Applications
In the sidebar menu, you will find the Applications section. Here, you can view and manage all the apps you’ve created.
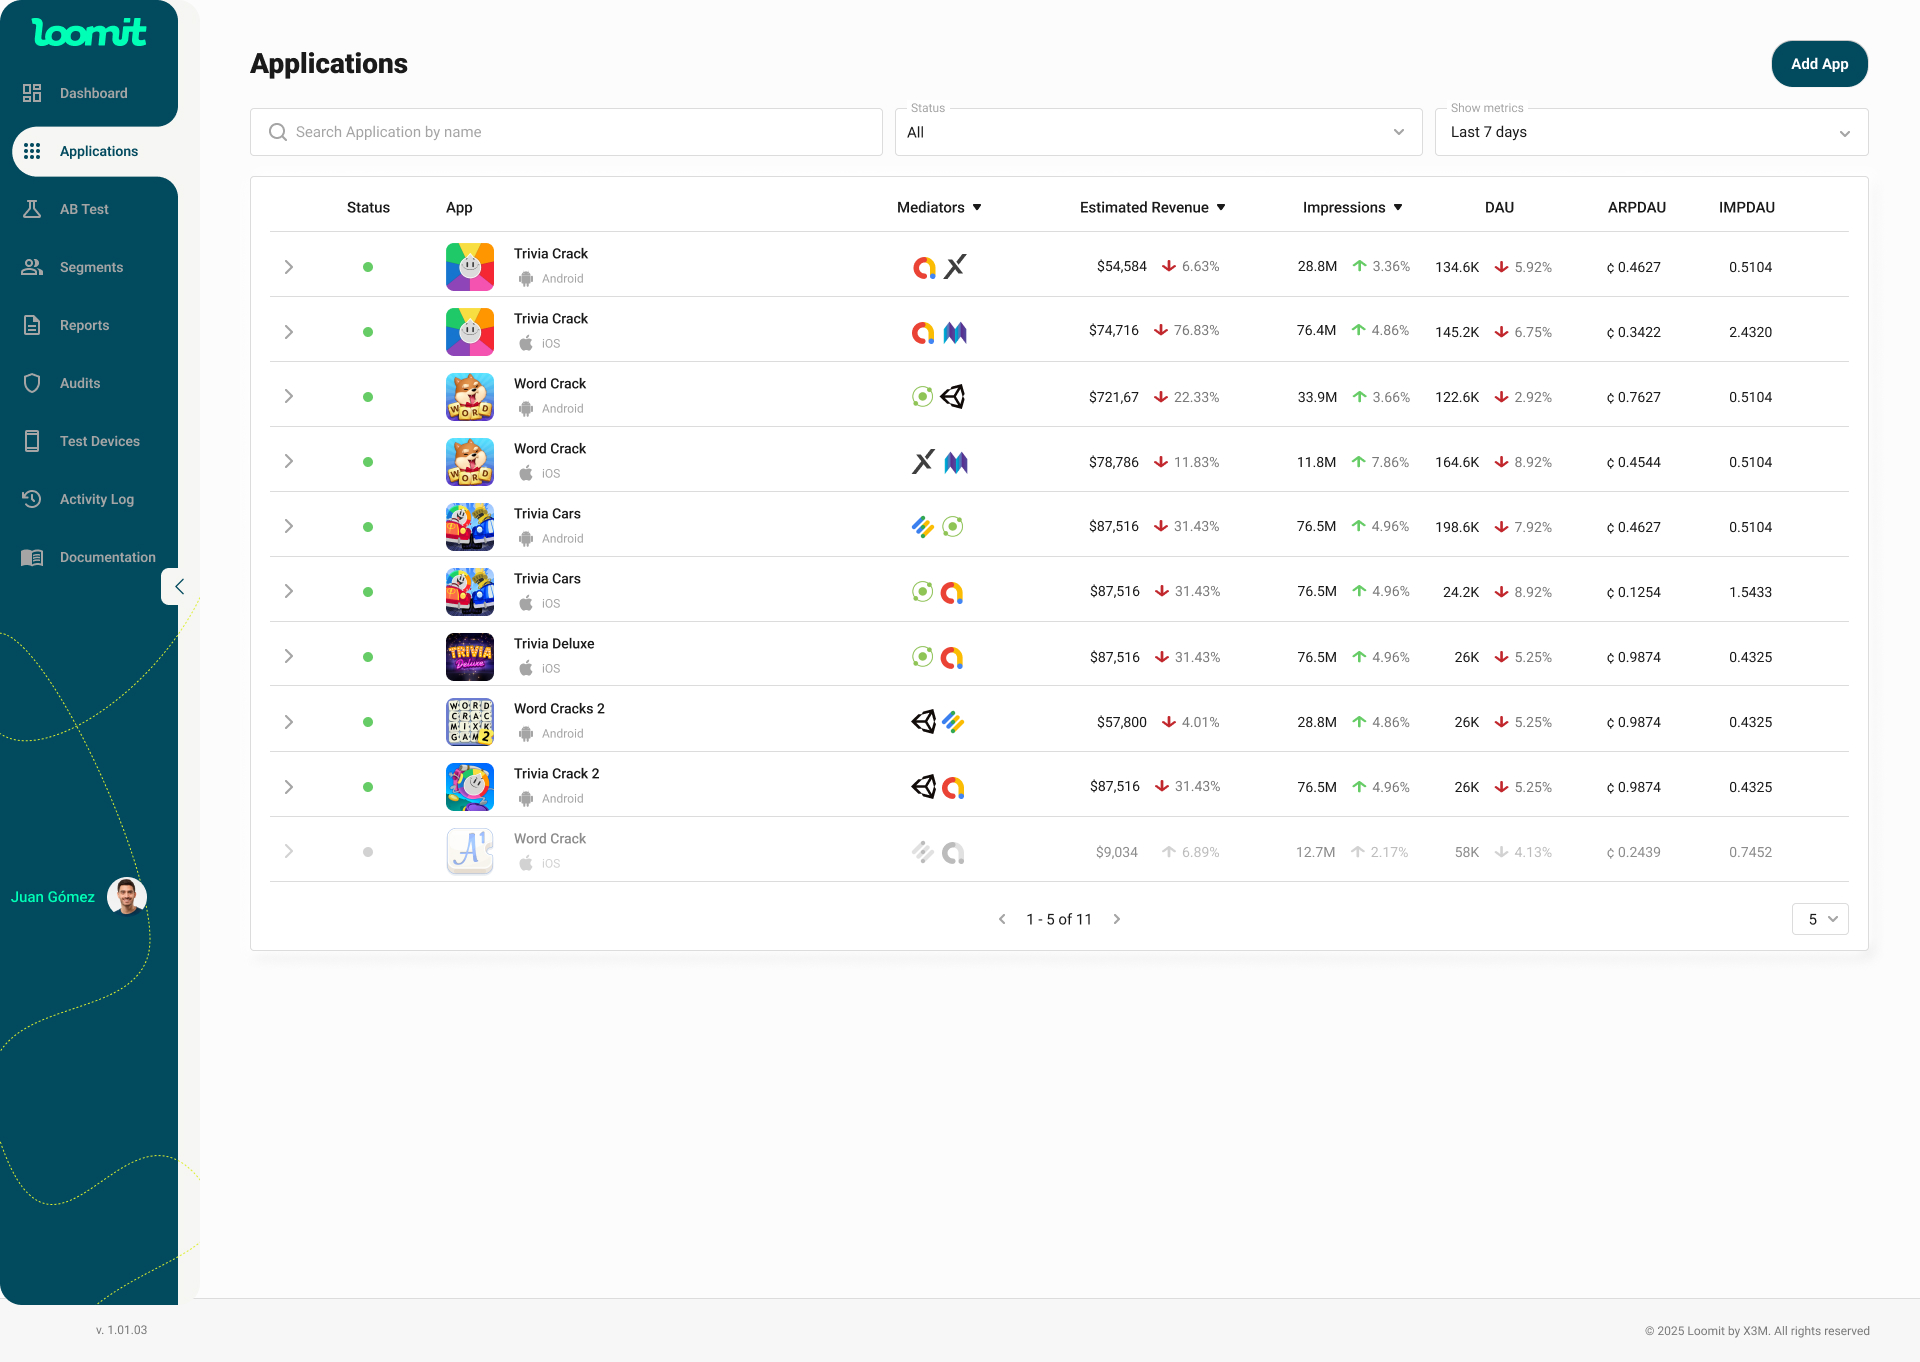
Features
- Add App Button: Allows you to add a new application.
- Application Table: Displays an overview of all apps with the following columns:
Table Columns
-
Status: Indicates the current status of the application:
- 🟢 Active: The app is running.
- ⚪️ Inactive: The app is not receiving traffic.
- 🟠 Waiting for data: The app is awaiting data updates.
-
App: Displays the app icon, name, and platform.
-
Mediators: Shows the logos of the mediation platforms connected to the application.
-
Estimated Revenue: Displays estimated earnings during the selected time range.
- Percentage change indicators:
- Decrease in revenue.
- Increase in revenue.
- No change or no metrics available.
- Percentage change indicators:
-
Impressions: Number of ad impressions served during the selected period.
-
DAU (Daily Active Users): Total unique users interacting with the app daily.
-
ARPDAU (Average Revenue Per Daily Active User): Average revenue generated per active user.
-
IMPDAU (Impressions Per Daily Active User): Average number of ad impressions per active user.
Expandable Section (App Row)
When expanding an application row (by clicking the arrow), additional insights appear:
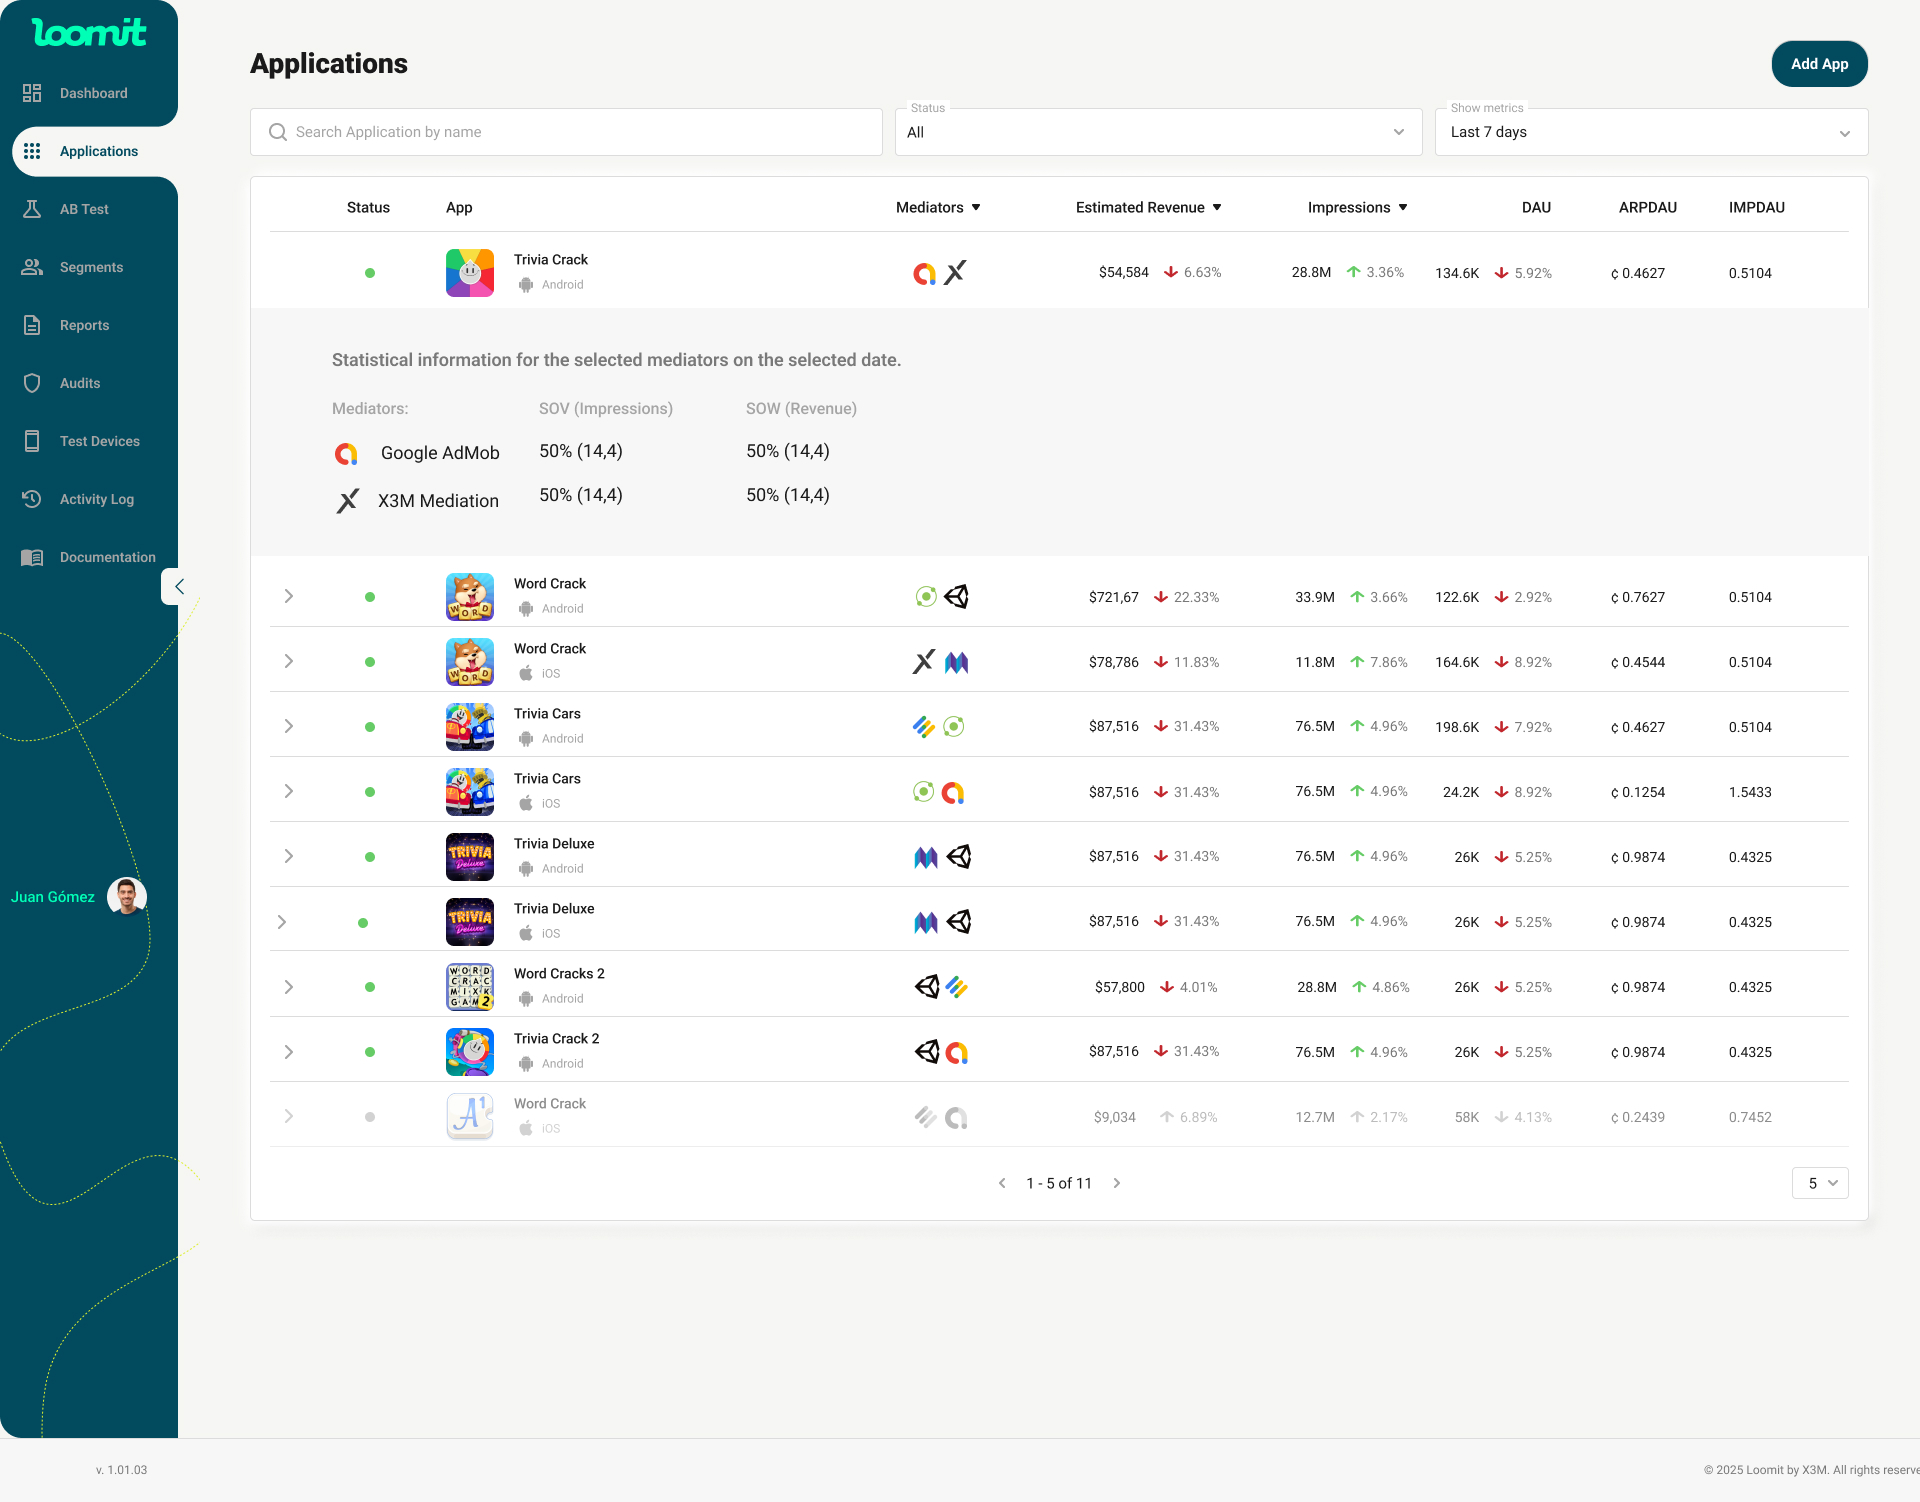
Statistical Information
- Active Mediators: Lists the mediation platforms actively working with the app.
- SOV (Share of Voice): Measures the percentage of total ad impressions a mediator receives compared to others.
- SOW (Share of Wallet): Represents the percentage of total revenue generated by a mediator compared to all mediators.
Filters and Search Options
- Search by Name: Quickly locate a specific app.
- Status Filter: Filter apps by their current status (Active or Inactive).
- Show Metrics (Date Range): Select the time period for displaying metrics (e.g., Last 7 days).
App Dashboard
Overview
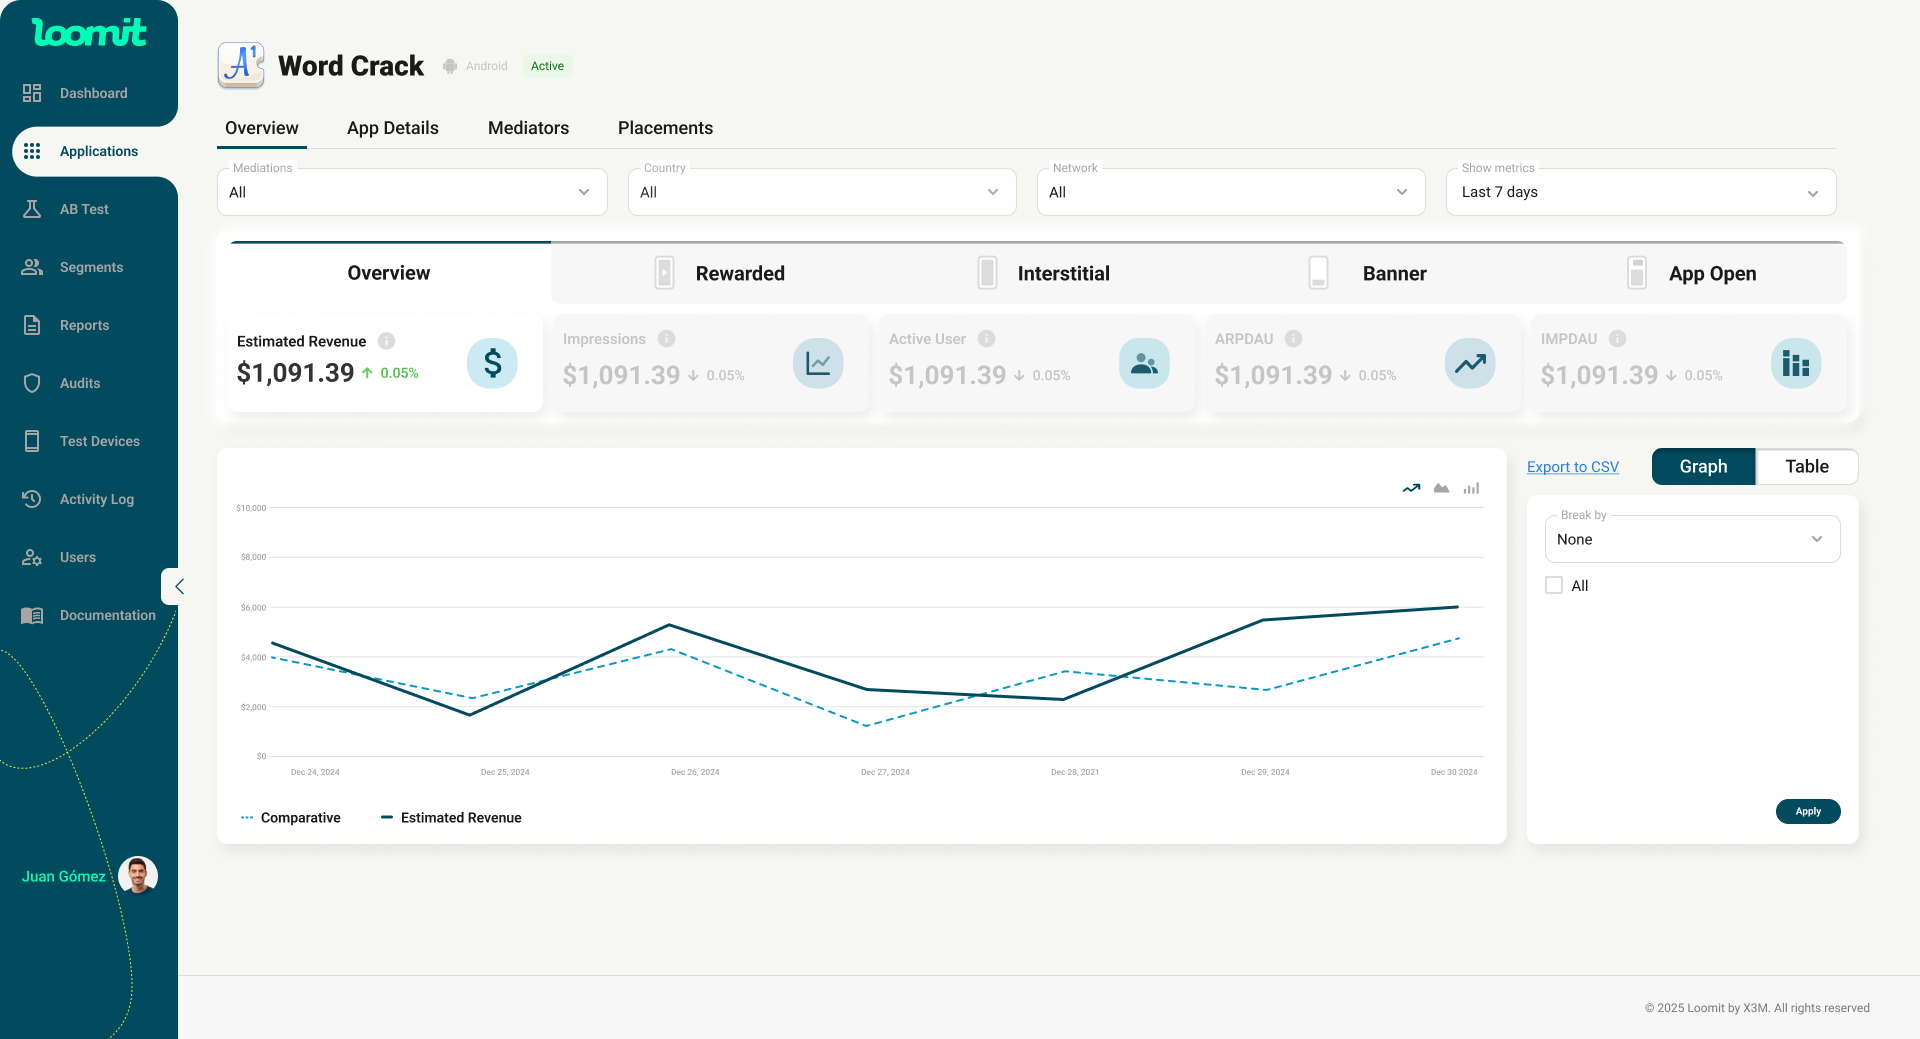
Filters, Ad Type, and Metrics Breakdown
At the top of the Overview tab, you will find four filters to customize your data view:
- Mediators
- Placements
- Country
- Show Metrics
Below the filters, the data is segmented by Ad Type and Metrics.
Ad Type Tabs
- Different ad types categorized for performance analysis.
Metrics Cards
- Estimated Revenue: Sum of all app earnings in the selected period (approximate value).
- Impressions: Total number of times an ad has been viewed.
- Active Users: Total daily active users across all apps.
- ARPAU: Average Revenue Per Active User for the group.
- IMPAU: Impressions per Active User.
Graph
- The graph dynamically updates based on the selected metric.
- Colors change to reflect specific data variations.
Placement Performance Table
- Placement Names: Lists all ad placements.
- Configured Mediators: Displays which mediators are assigned to each placement.
- Key Performance Metrics: Detailed performance data per placement.
- Clicking on a placement name opens its detailed view.
App Details
You can view and edit your app’s main information.
- App Name & Icon – You can update these at any time to ensure your app’s details remain accurate and aligned with your store listing.
- App URL – If you didn’t provide a URL when creating the app, you can add it here and validate it. This helps keep your app profile complete and consistent with the store.
App integration keys
Below the app details, you’ll find the keys required to configure the SDK.
- These keys are essential for enabling mediation and tracking performance.
- Ensure that you share them with your development team so they can properly integrate the SDK. Without this step, you won’t be able to start receiving traffic or see performance metrics.
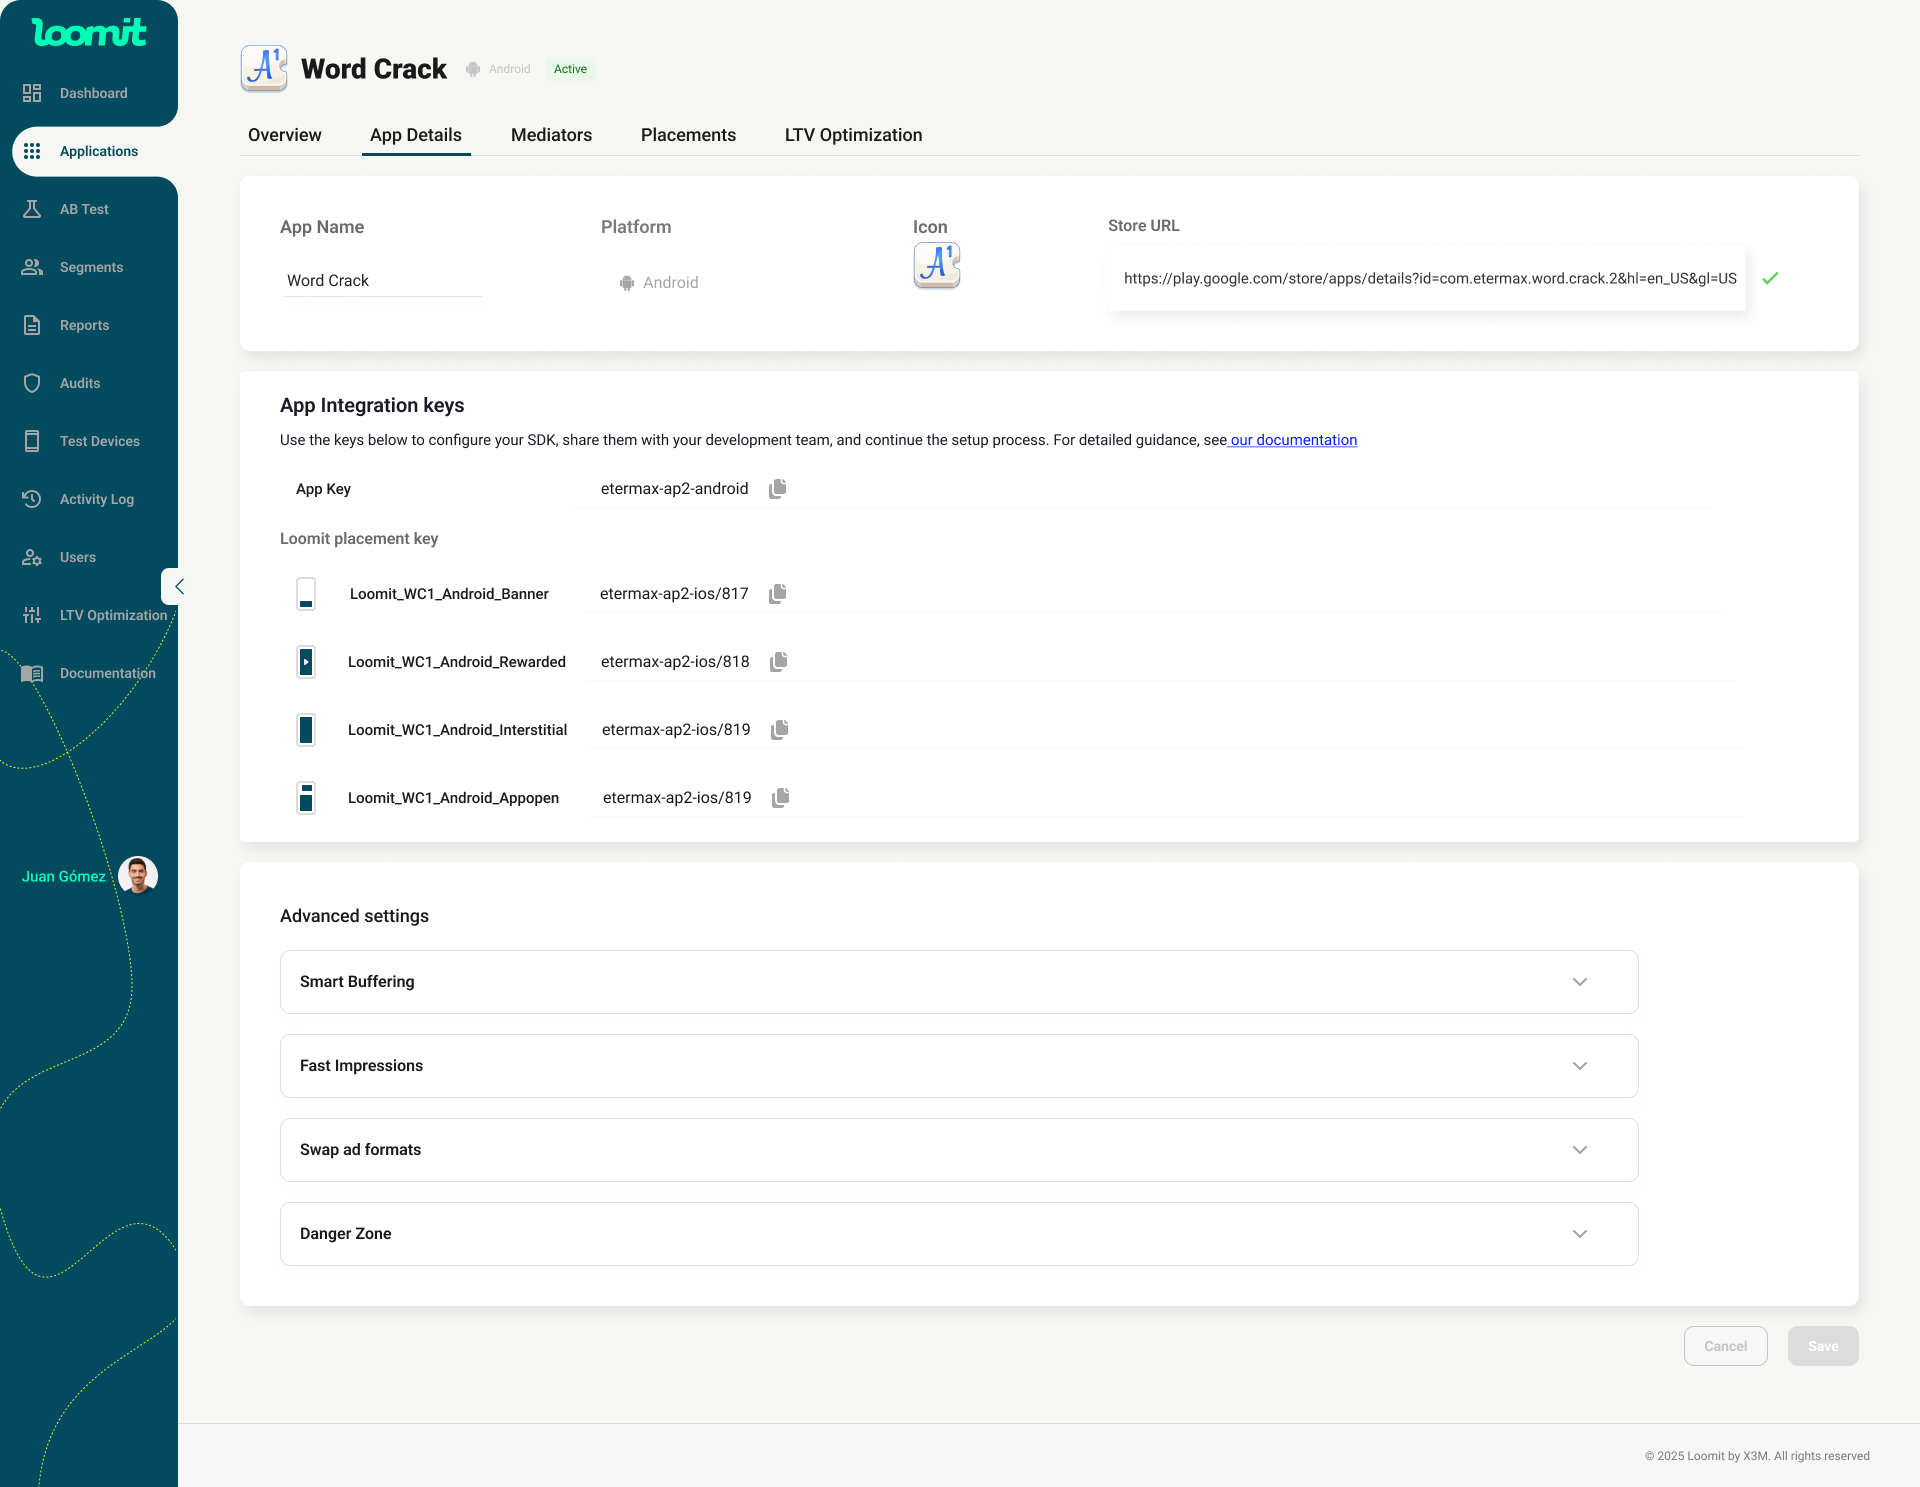
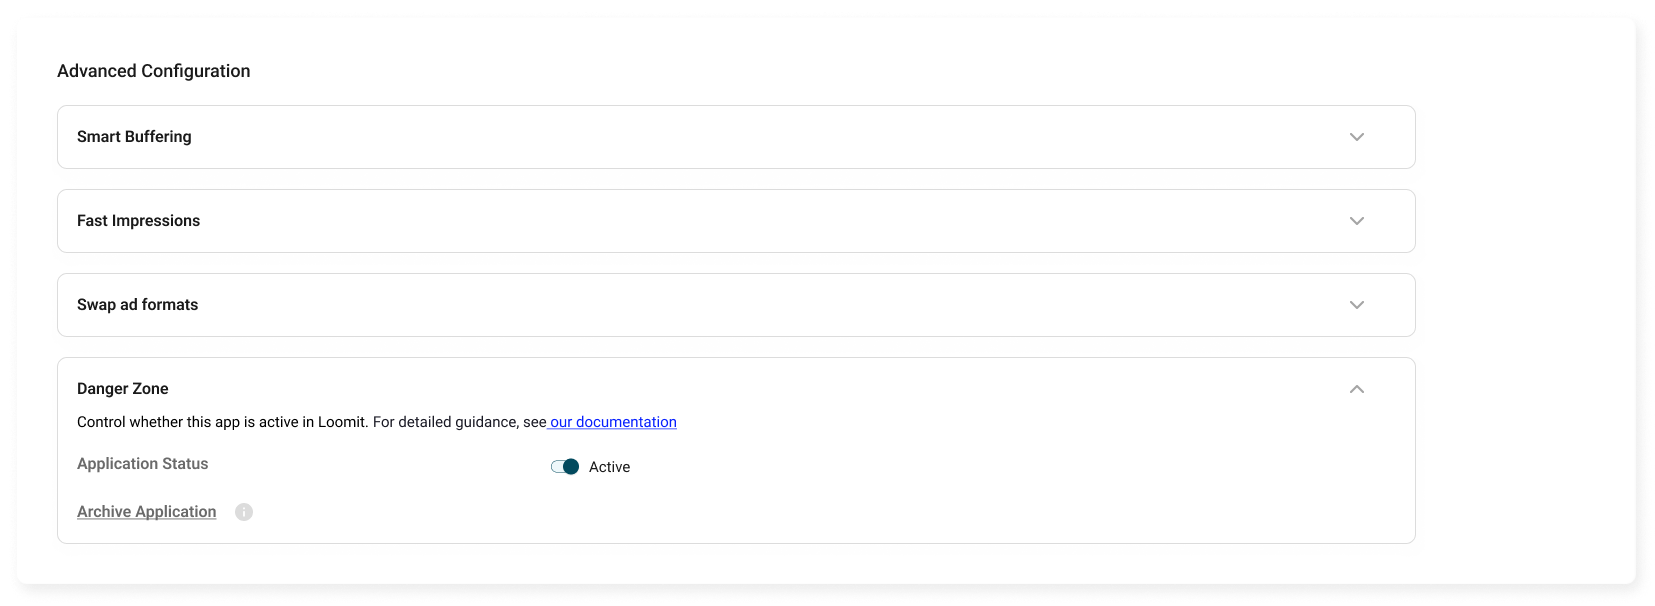
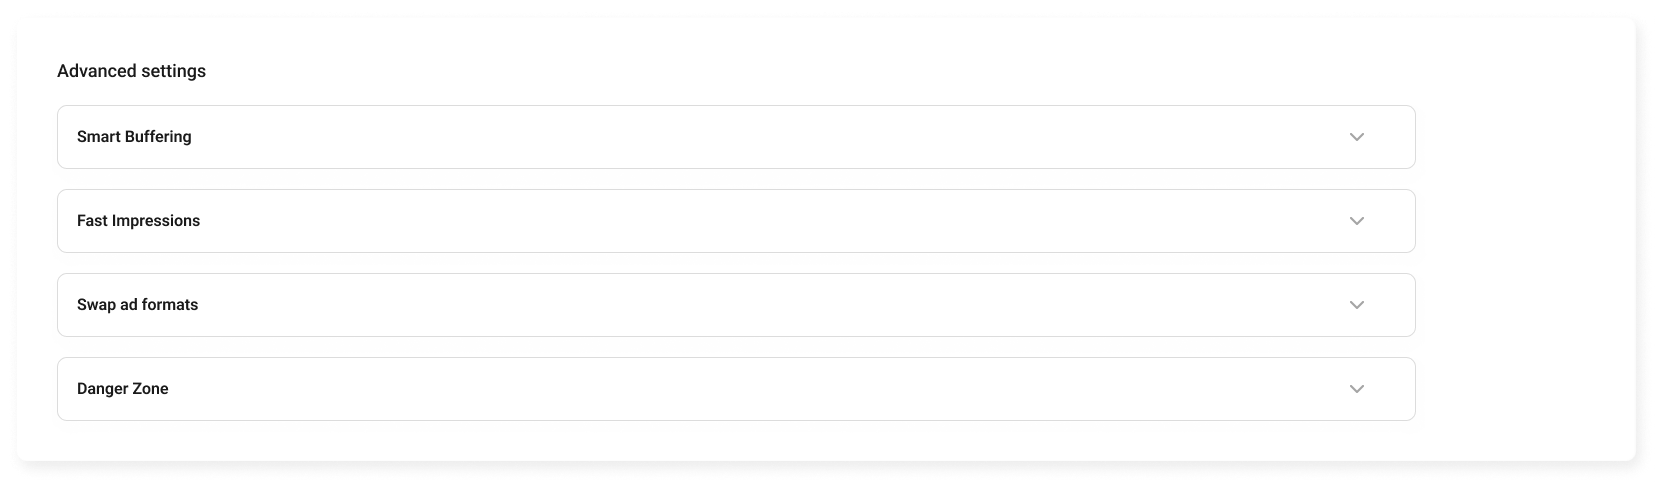
Advanced settings
- Smart Buffering : Optimizes latency and impression timing by controlling when ads are shown.
- Fast Impression : Counts impressions earlier, improving reporting speed and ad delivery tracking.
- Swap Ad Format : Dynamically switches between ad formats (e.g.,rewarded, interstitial).
- Danger Zone : Section dedicated to shutting down and archiving the application
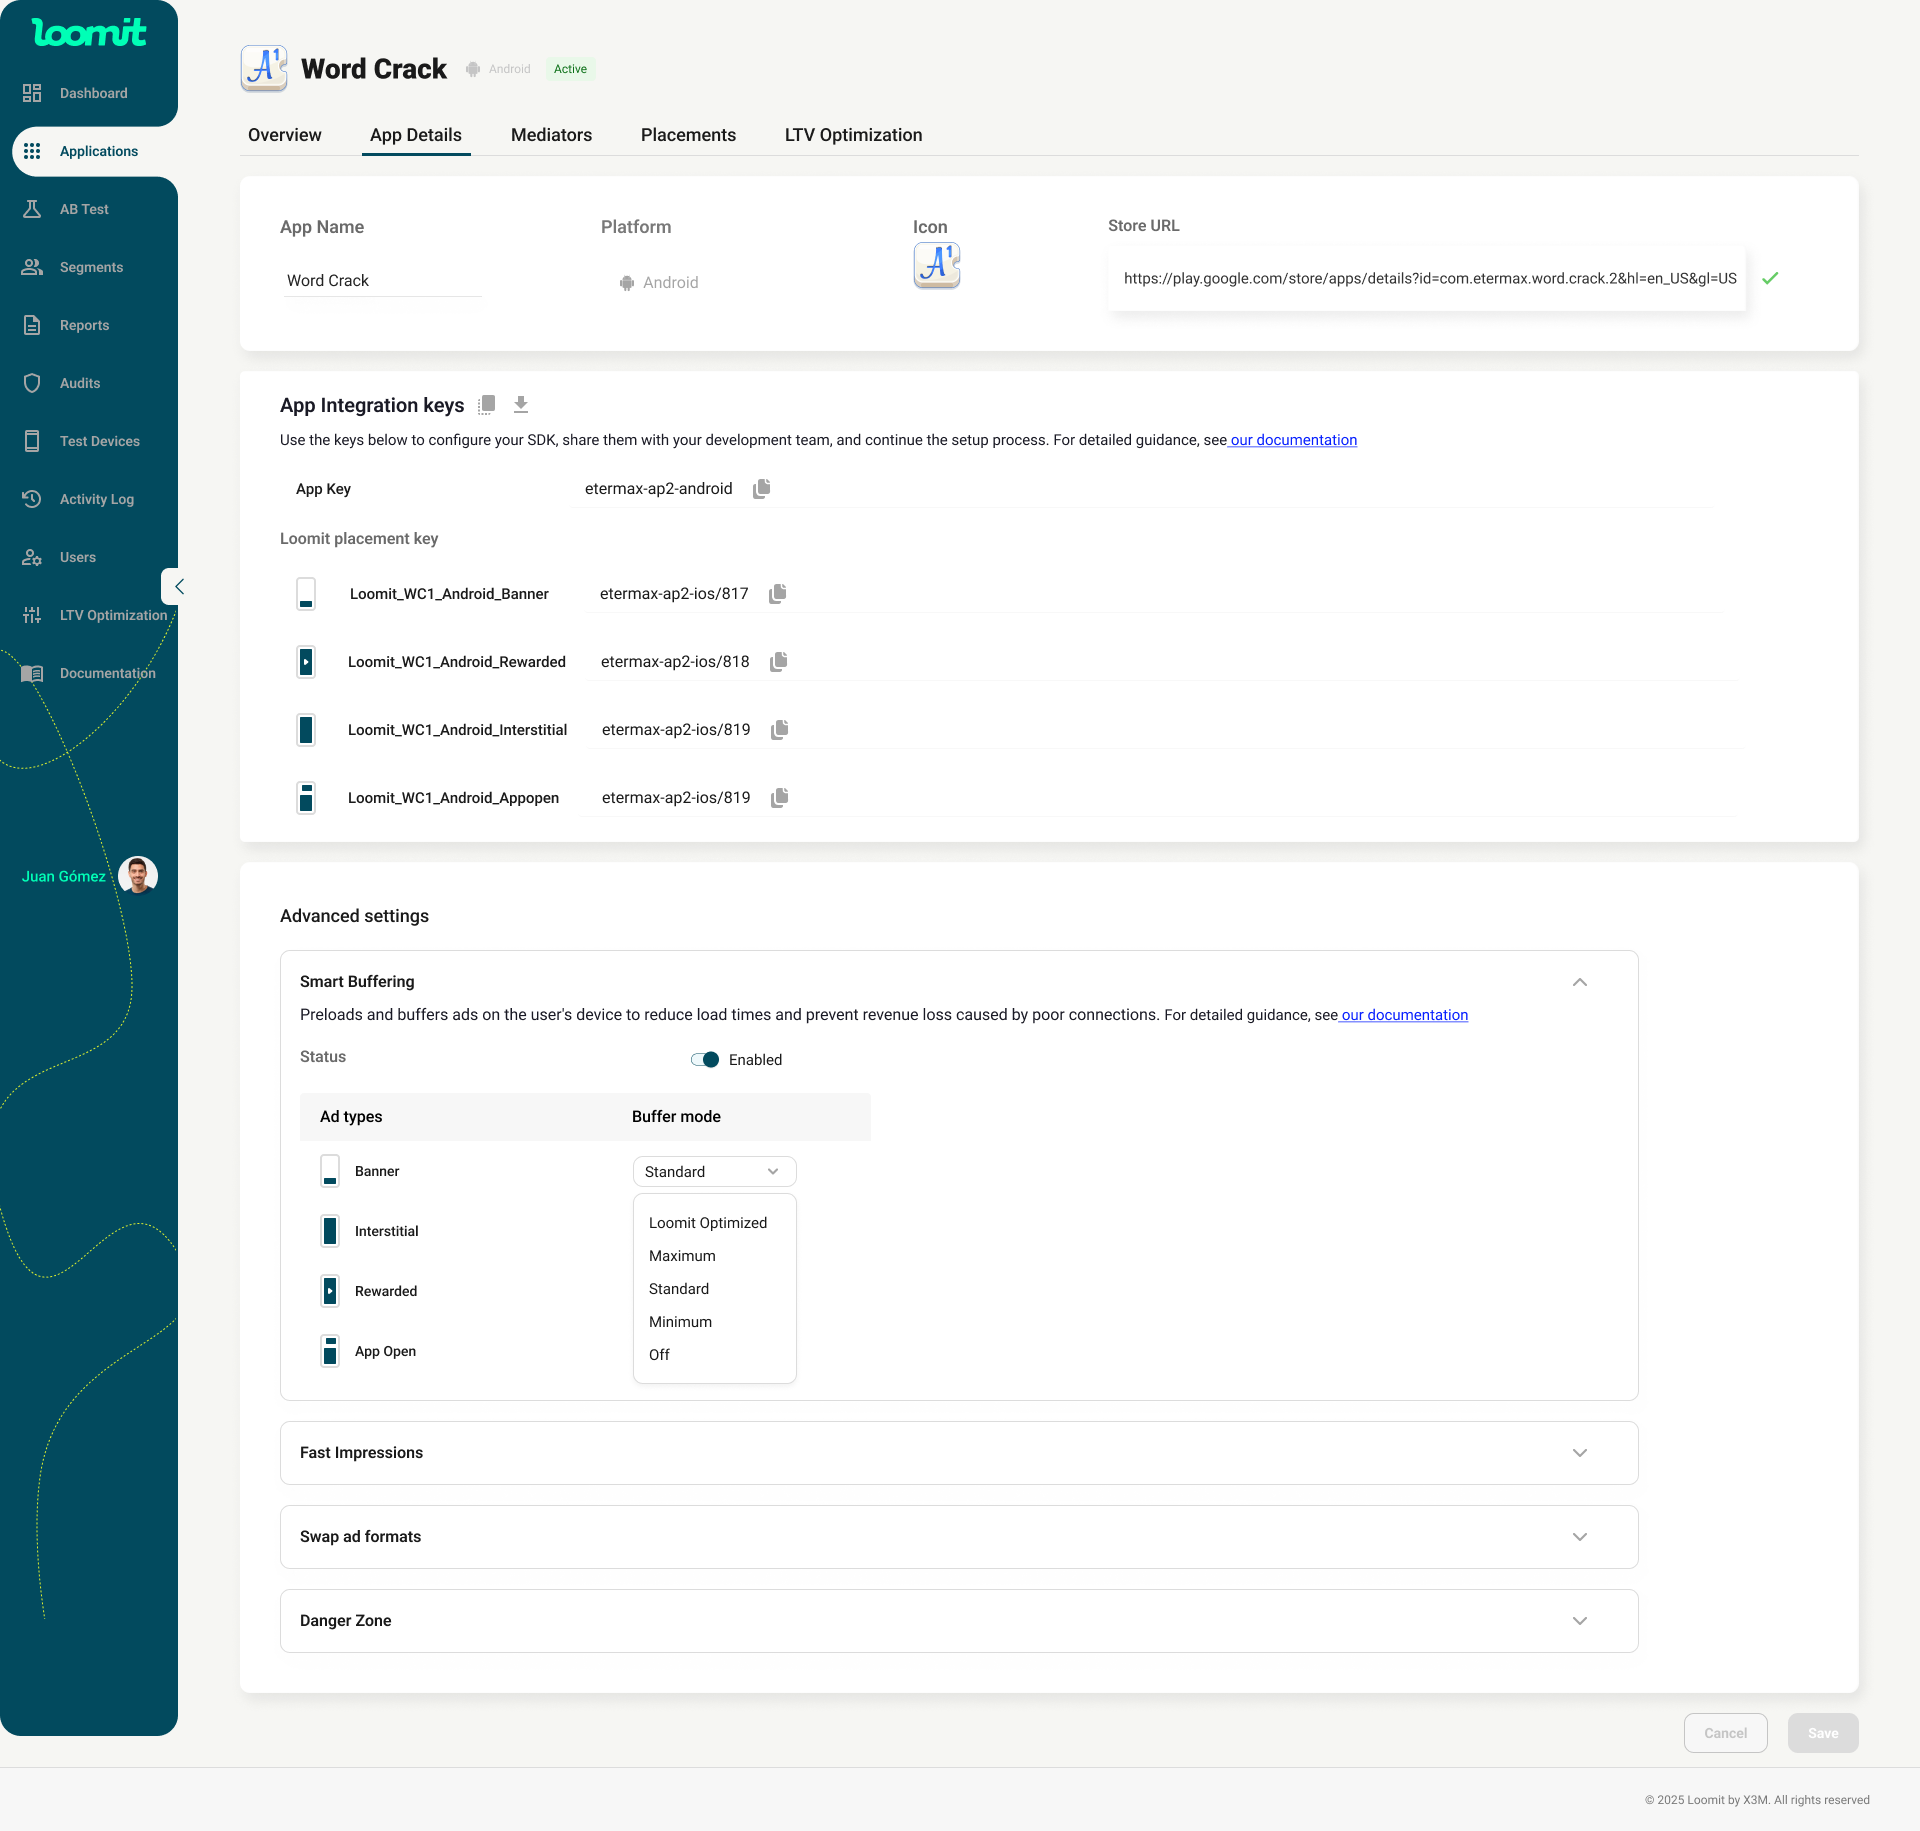
Smart Buffering
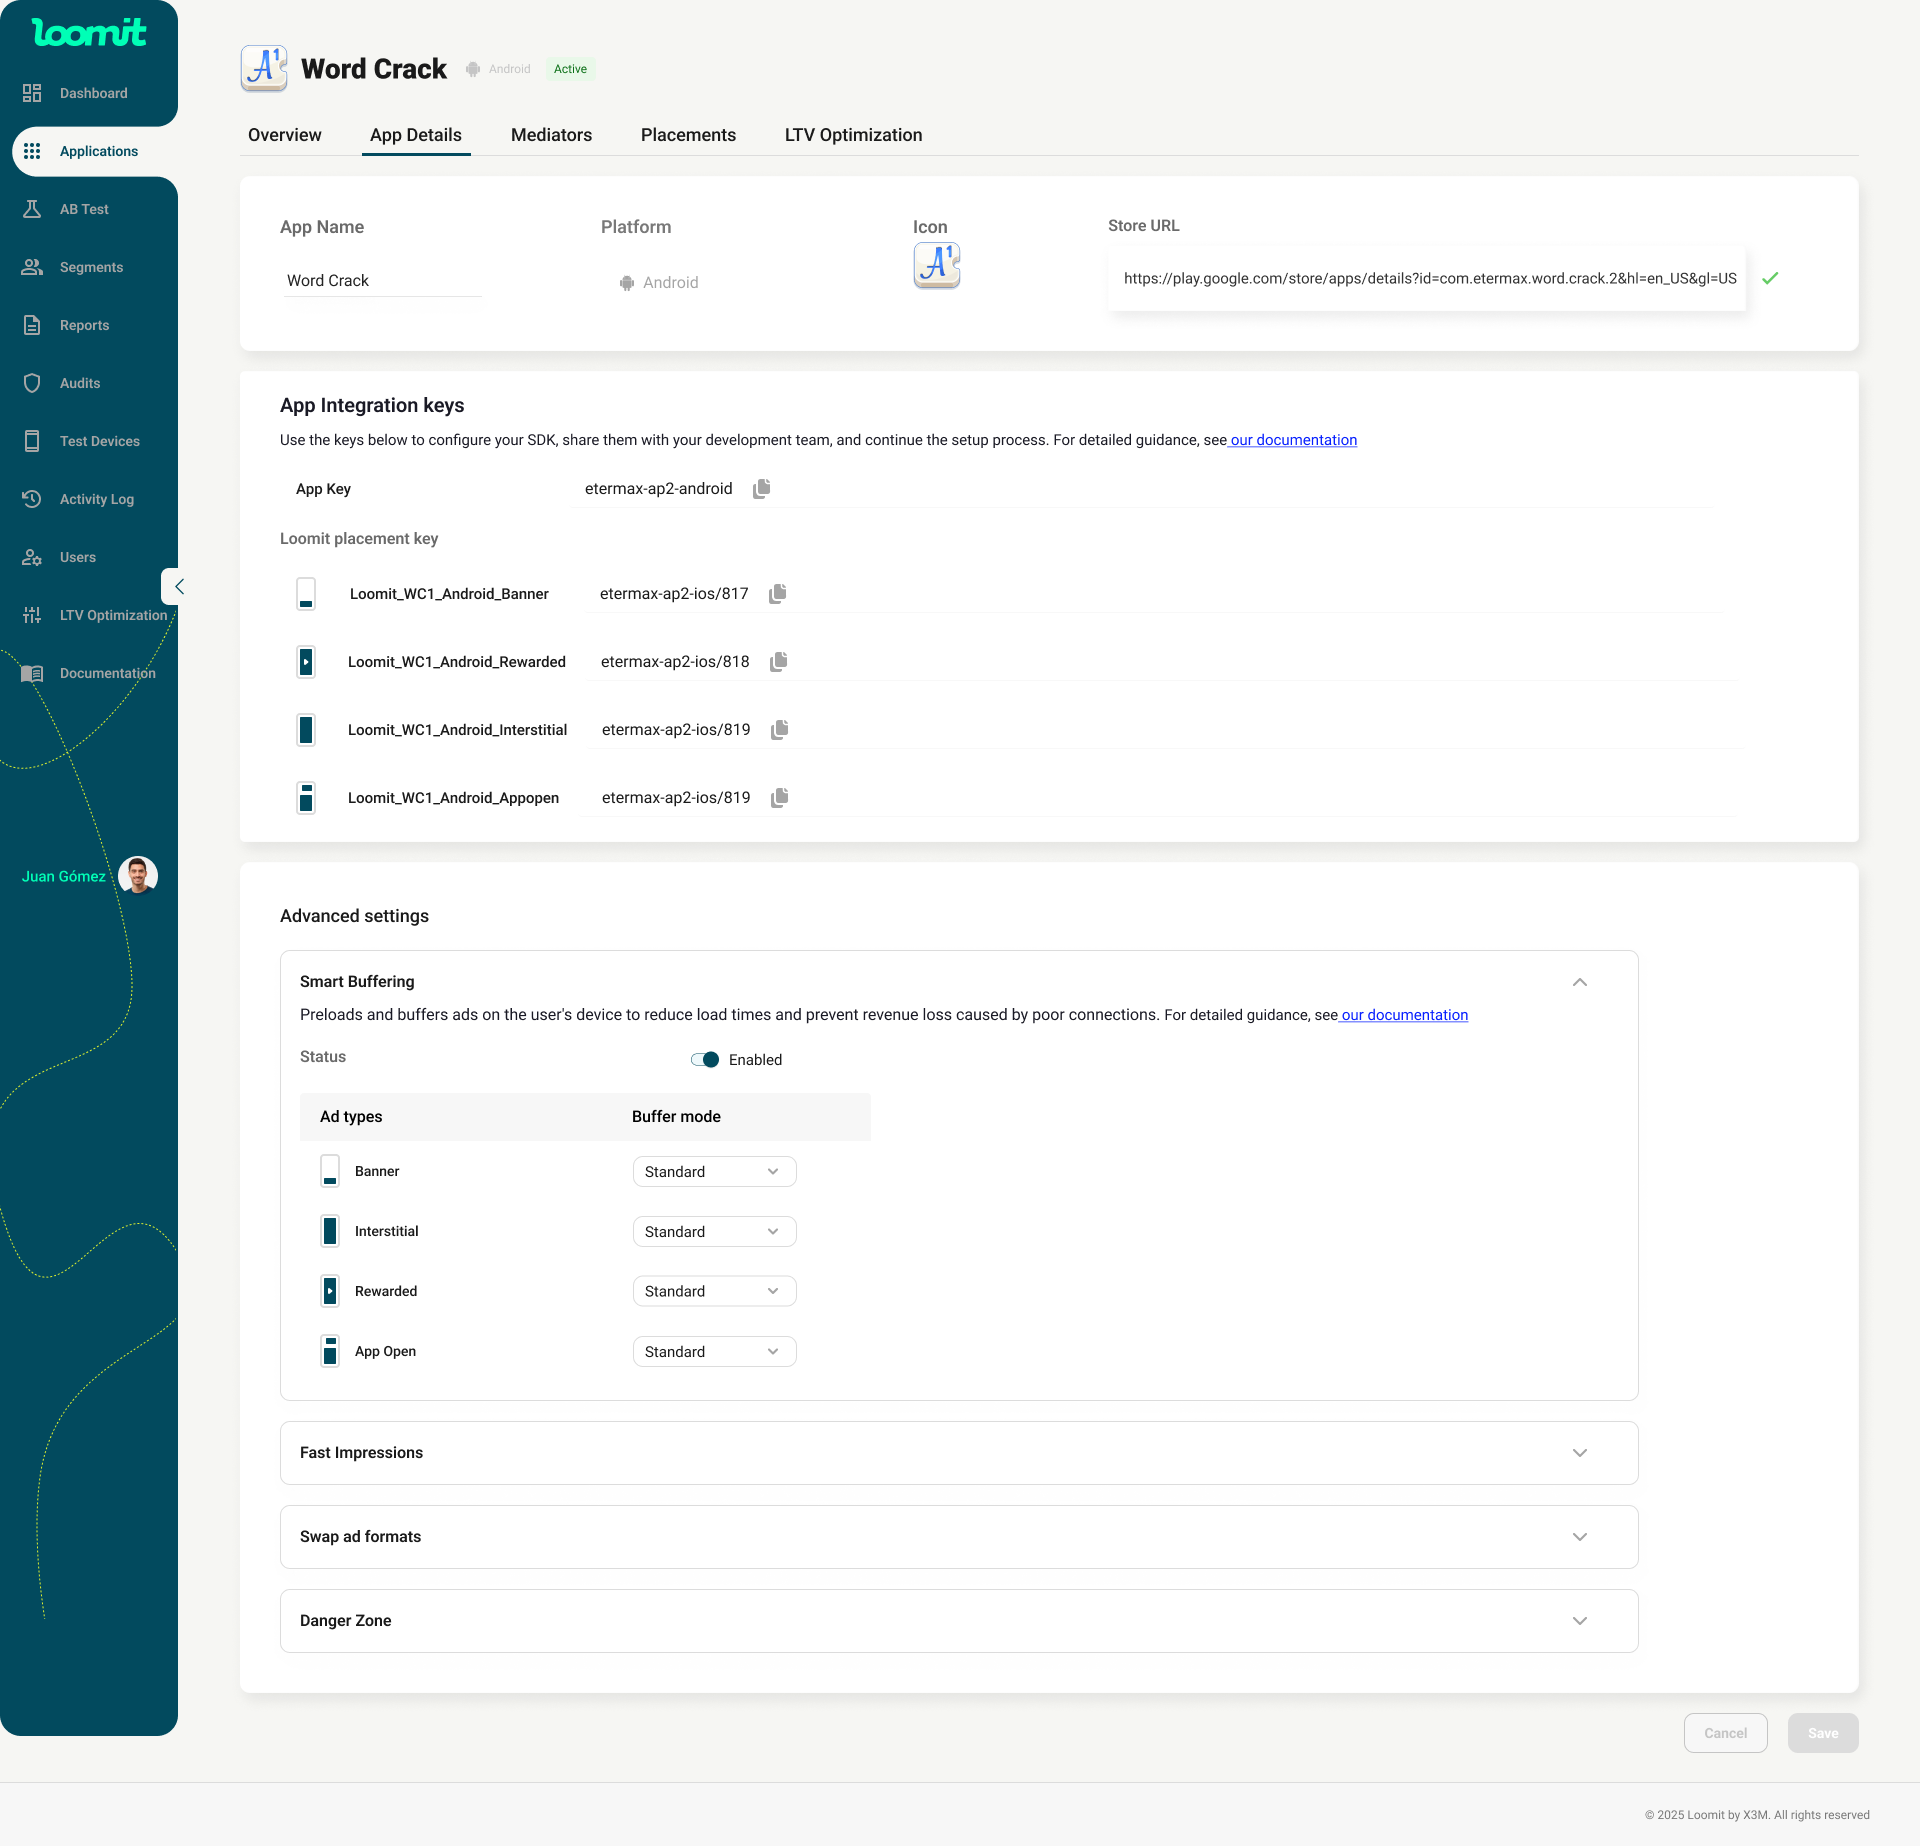 The Smart Buffering functionality is available in the App Details tab, specifically within the Advanced Settings section. The Smart Buffering configuration subsection is collapsed by default, but the entire Advanced Settings section is visible.When expanding the Advanced Settings section, a direct link to the technical documentation is available.
- Default State: Smart Buffering is disabled by default.
- Initial Configuration: Ad types are automatically set to Optimized mode.
- Behavior: Disabling Smart Buffering at the application level automatically disables all buffer mode selectors.
- If an A/B test for Smart Buffering is active, it cannot be disabled at the application level. The option will be locked.
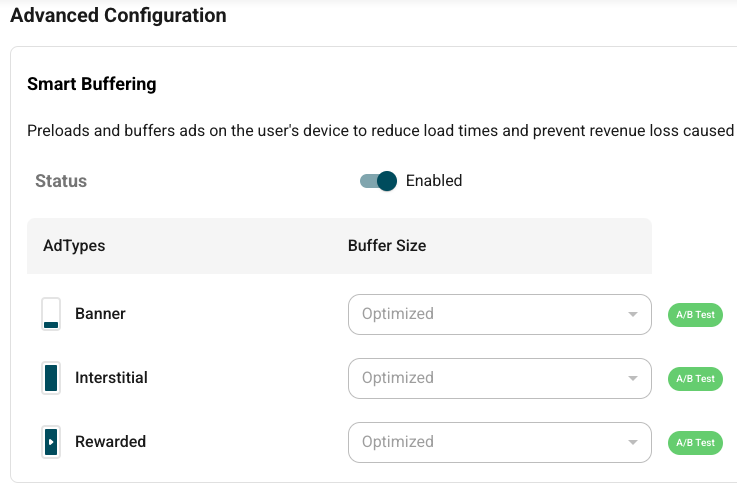
Available Buffer Modes
Smart Buffering offers four configuration modes:
- Loomit Optimized (recommended) – Currently mapped internally to Standard. In the future, this will support a more intelligent configuration.
- Maximum
- Standard
- Minimum
- Off
Change Management
- Selecting and modifying the buffer size enables the Save button.
- Once changes are saved, the system displays a confirmation message.
Fast Impressions
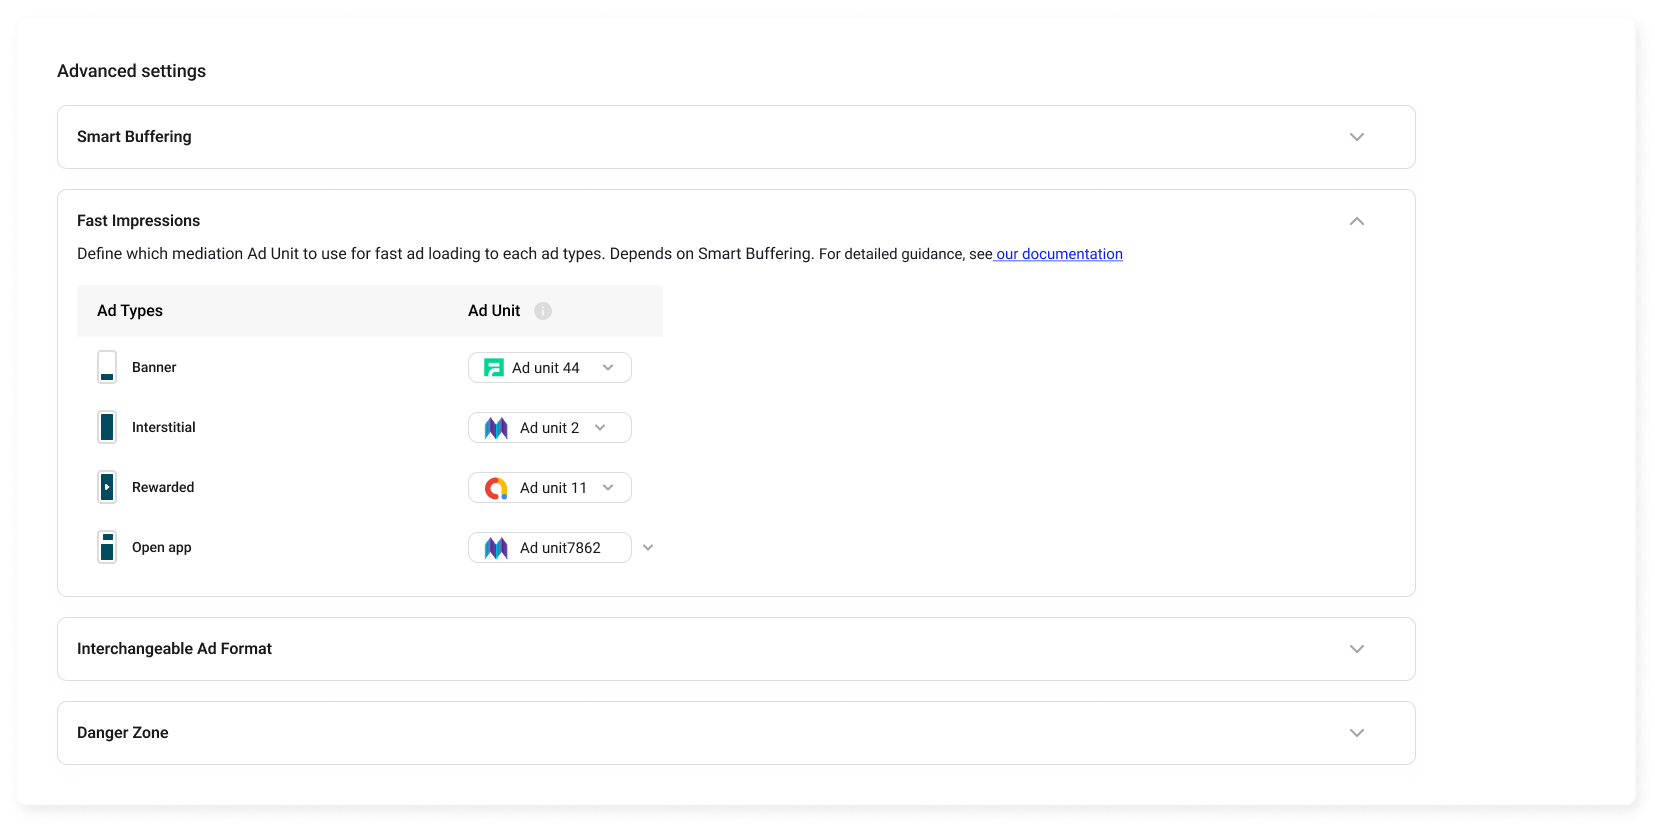 Fast Impressions optimizes ad placement and bidding during new users’ first sessions to help maximize early revenue. This feature works by prioritizing ad delivery for these users, increasing the likelihood of higher-value impressions during initial gameplay.
Important: Fast Impressions requires Smart Buffering to be enabled. Disabling Smart Buffering will automatically disable Fast Impressions as well.
How to Use:
- Ensure Smart Buffering is active in the Advanced Settings panel.
- Select the Ad Types you want to optimize for Fast Impressions (e.g., Banner, Interstitial, Rewarded, App Open).
- Assign the corresponding Ad Units from your mediation setup to each selected type.
- Save your changes to apply the configuration.
This setup ensures that selected ad formats deliver faster during the first user sessions, boosting engagement and revenue potential.
Swap ad formats
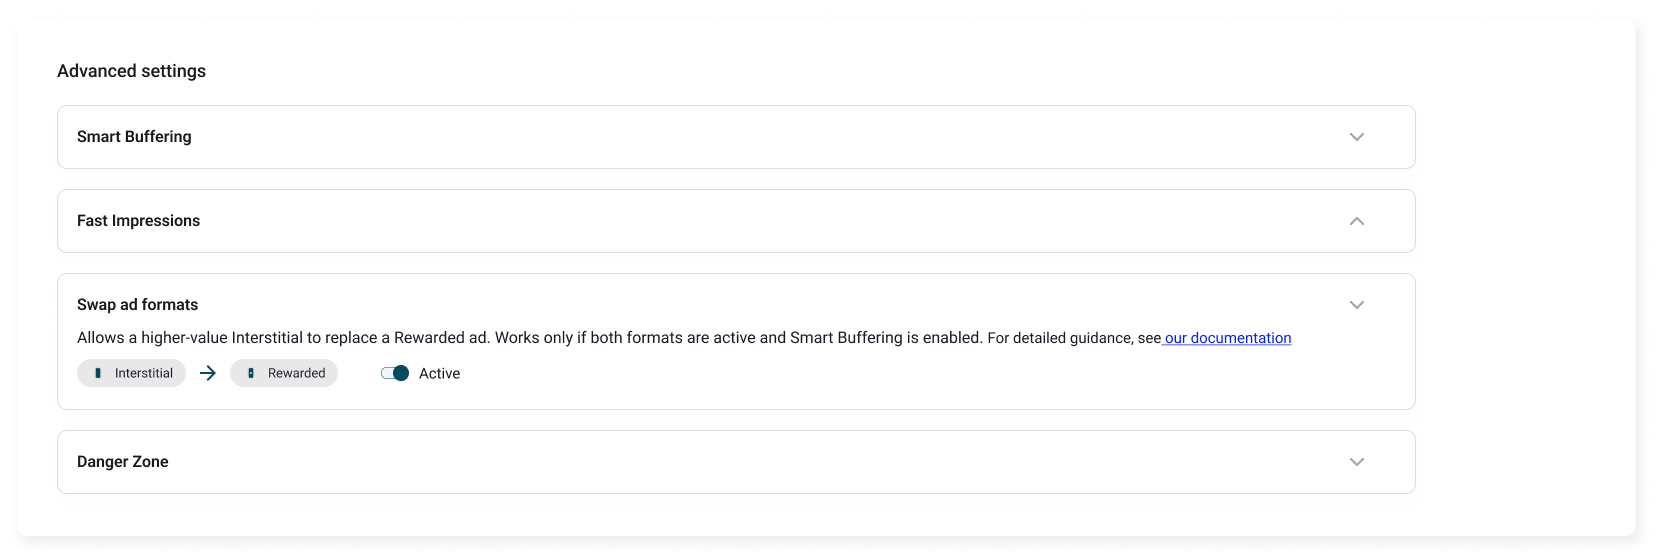
Swap Ad Format allows the system to replace a lower-value Video Rewarded ad type with a Interstitial ad type higher-value when both are active, helping maximize revenue opportunities.
Important: Swap Ad Format only works when:
- Both ad formats are active (Rewarded & Interstitial).
- Smart Buffering is enabled in both formats.
How to Use:
- Enable Smart Buffering in Advanced Settings.
- Select the two ad formats you want to swap (e.g., Interstitial ↔ Rewarded).
- Toggle the feature to Active.
- Save your configuration to allow replacements during delivery.
This feature helps maximize ad monetization by dynamically selecting the most profitable format while ensuring a seamless user experience.
Danger Zone
Actions here can significantly impact your app’s availability and monetization:
-
Turn Off Application – You can disable the app from this section as well. Doing so will immediately stop monetization and is not recommended unless necessary for operational or compliance reasons.
-
Archive Application – Permanently archives the app, preventing any further edits or mediation. Use this only if you are certain you no longer want the app active on the platform.