Audits
The Audit functionality refers to querying the Partner about the revenue values of each Partner's instance. The functionality compares the revenue reported by each network with what X3M detects, providing the necessary tools for AdOps users to make changes to the involved systems' configurations.
Audits consist of two parts, configuration and reporting. The first is located within the Partner configuration at the Organization level, and the second is located in the main menu under the Setup section.
Configuration
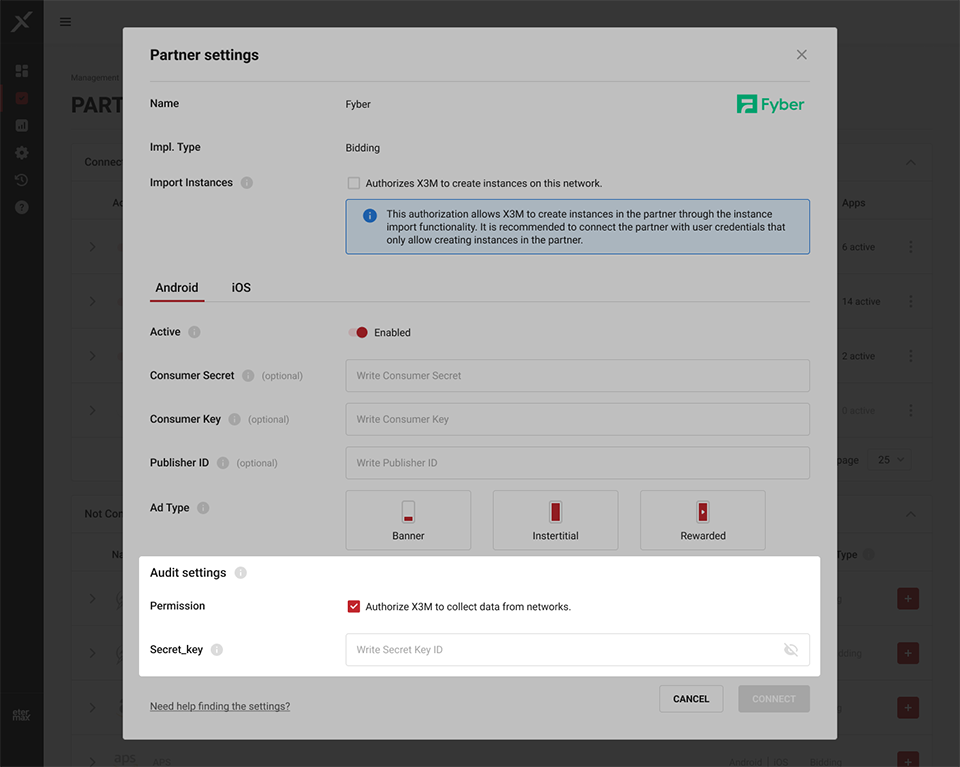
Audit configuration is at the organization level for each partner below the partner's data.
- To enable the functionality, consent must be given by approving the audit to the partner by checking the corresponding box.
- Once this consent is given, the user must input the required parameters that depend on the specific partner.
- This should be done for each platform if necessary.
Report
The audit report is located within the Analytics section, where we will have a comparative report of the data that X3M shows us with the actual data from the Partners. When accessing the section, the filters will be disabled except for the Application selector. This filter, like the others, allows multiple selections.
Separate from these, are the Show metrics filters, where we can choose the range of the metric period, as well as the Show results filter, which presents two types of visualization of these metrics. We can view the difference between the Partner's metrics and X3M's in value and percentage or see the absolute values of the two side by side.
Below the filters, there is an Overview and the Estimated Revenue and Impressions tabs (closed). The Overview shows a quick overview of the biggest differences between the Partner's values and X3M's. It has a dynamic behavior in which it reacts to the filters, showing the biggest differences in both Revenue and Impressions for a specific filter.
By default, when no applications have been selected yet, it shows the biggest differences by application. The type of difference it will show will be related to the last selected filter, in a stairway sense. For example, if we select a Partner, the overview will show differences by the next filter in the order, which is Ad Type.
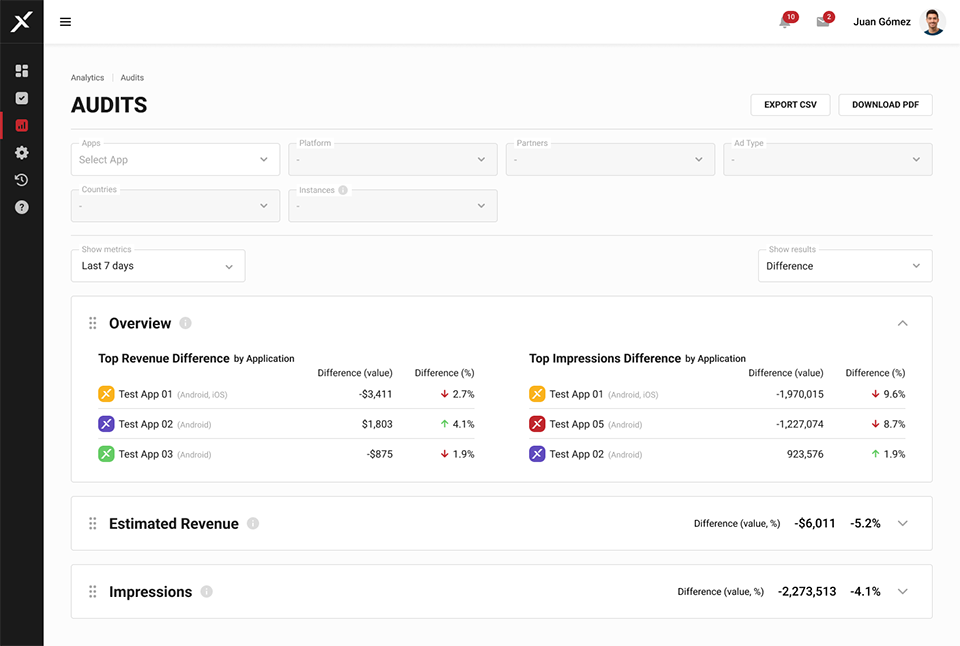
The difference by value is calculated based on the actual value given by the [[02-07-partners]] compared to what X3M presents. That is: (absolute value of Partner) - (absolute value of X3M).
The difference by percentage is based on the actual value given by the Partner compared to what X3M presents. That is:
Partner value - 100%
X3M value - x
Difference (%) = 100 - x
The metric tabs, when expanded, show the differences in value and percentage or the absolute values depending on what is selected in Show results.
On the right-hand side is the Break by with the options mentioned above. Like with the filters, the Break by Instance is only enabled when we have selected a maximum of one application and one Partner.
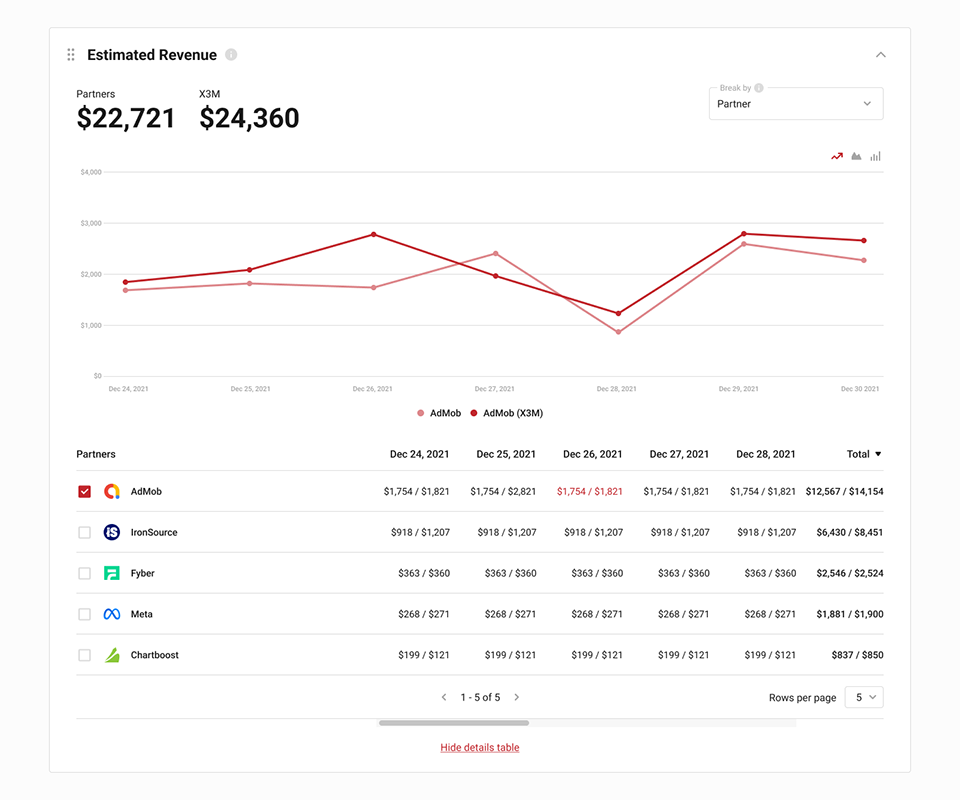
The graph has a safe range, which is the range of acceptable discrepancy. This is a fixed range that alerts by marking values in red when they fall outside of what is accepted.
Below, we will find a table with a list of all the entities participating in the app's partner. This table will have the following columns:
Radio button to select the visualization in the graph
Application/platform/partner/ad type/country/instance name
Value of X3M / Value of Partner or Difference (value) / Difference (%) per day.
Both the radio button and the entity name and total will be fixed, and the day values can be scrolled through. This is repeated for the other metrics.