Dashboard
Your performance at a glance
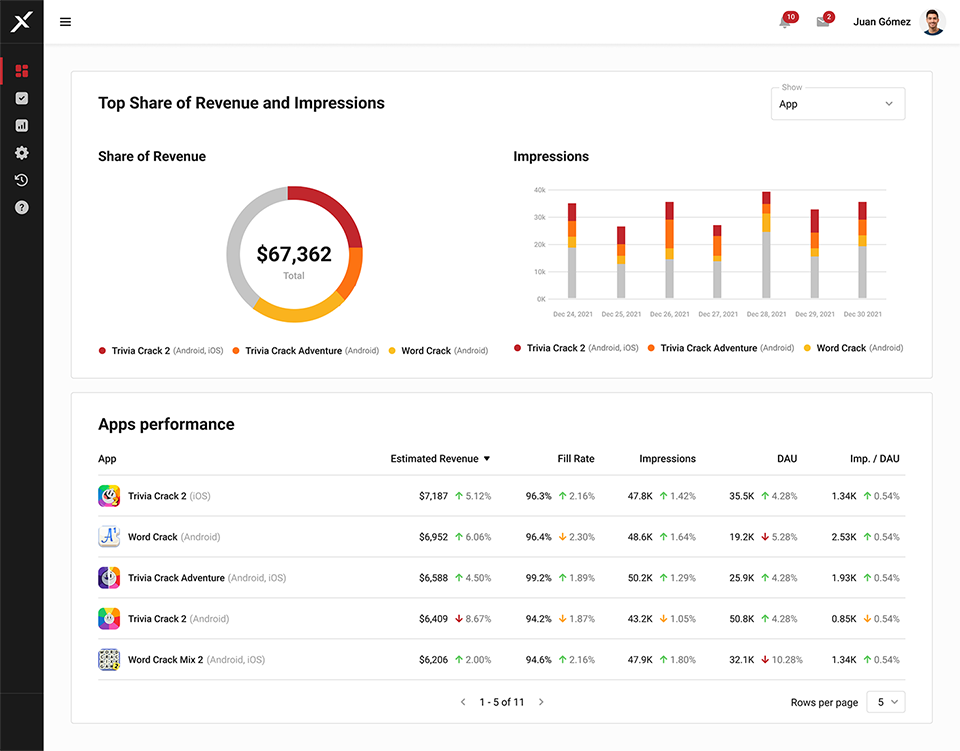
X3M Dashboard provides a consolidated view of key performance indicators for your organization's applications. Accessible from the left-side menu.
Browse the key metrics
At the top of the Dashboard, you'll find some key metrics showcased in line, area, or bar graphs (you can choose the mode at the top right corner of the chart).
-
Estimated revenue: Sum of all app earnings in the selected period. This number may not be exact.
-
Impressions: Number of times an ad has been viewed by a user.
-
Fill rate: Percentage of ad requests that were successfully answered with an agreed-upon price.
-
Active Users: Total daily active users across all apps.
Remember to select your desired time frame; by default, the last 7 days are displayed, this choice affects the entire Dashboard.
Below, you'll find the Revenue Share chart on the left side of the screen, enabling you to visualize which apps, platforms, or partners contribute most to your organization's revenue. Hovering over them reveals additional details.
Adjacent to it is the Impressions chart, also categorized by app, platform, or partner, offering insights into your daily performance within a selected timeframe.
App Perfomance
At the bottom of the page, you'll find the App Performance section, displaying data for each application:
- **Estimated Revenue
- **Fill Rate, Impressions
- **DAU
- **Impressions/DAU.
Alongside the figures, you'll see the variance between the selected timeframe and the previous period.
Add an app
At the top right of the Dashboard, you will see an Add App button. Learn more about Applications and how to create and edit them in the [[02-01-appl∏ications]] section.