Application overview
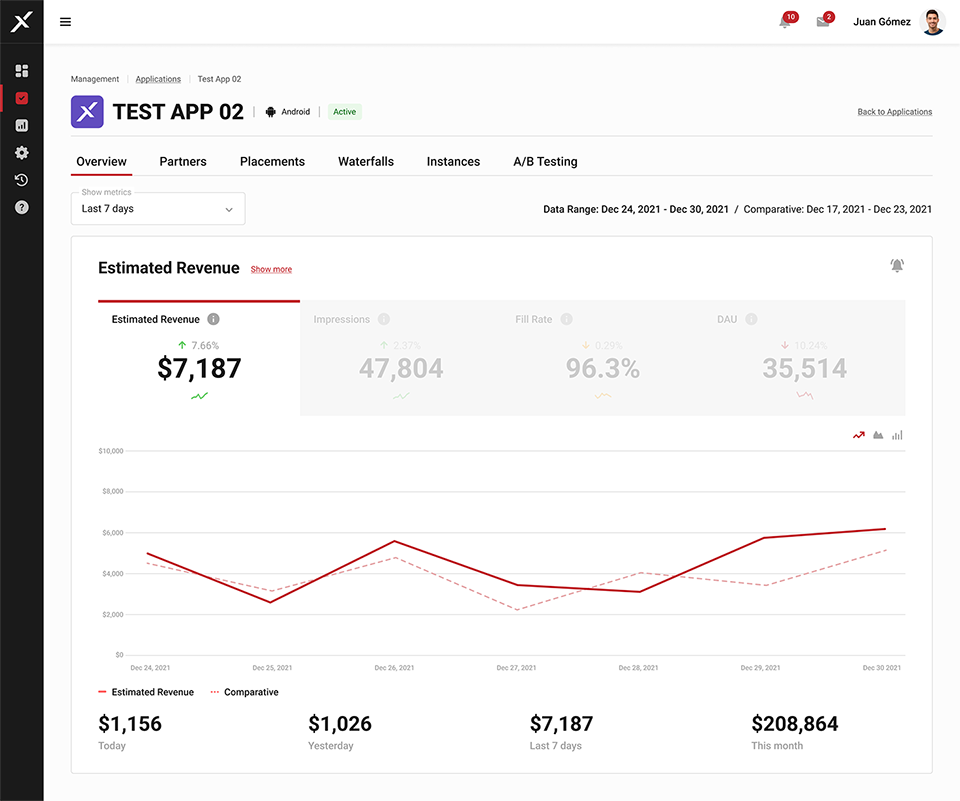
In the Applications Overview section, you can fully configure app monetization and view a summary of results. At the top, you'll find four key metrics displayed in line, area, or bar graphs (selectable in the top right corner):
- Estimated Revenue: Sum of app earnings in the selected period (may not be exact).
- Impressions: Number of times an ad is viewed.
- Fill Rate: Percentage of ad requests successfully answered with an agreement.
- Active Users: Daily Active Users.
Remember to choose the desired period, defaulting to the last 7 days and affecting the entire page.

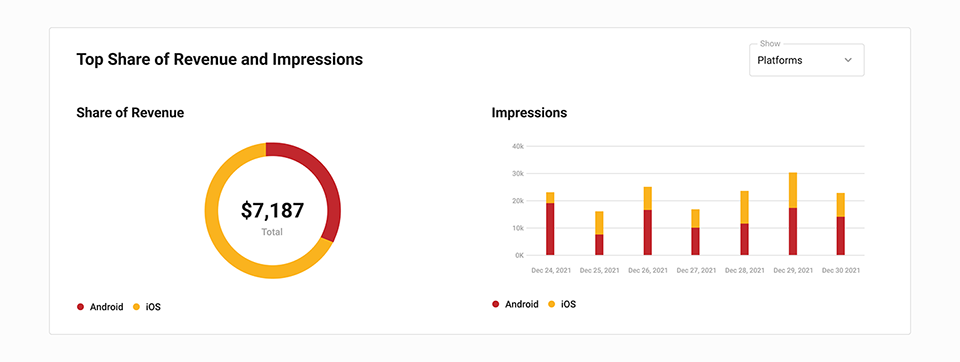
Further down, you'll encounter the Revenue Share chart on the left, allowing you to visualize top platforms, partners, or locations responsible for your app's earnings. Hover for more details.
Next to it, there's an Impressions chart, categorizable by platform, partner, or location, detailing daily performance in the selected period.

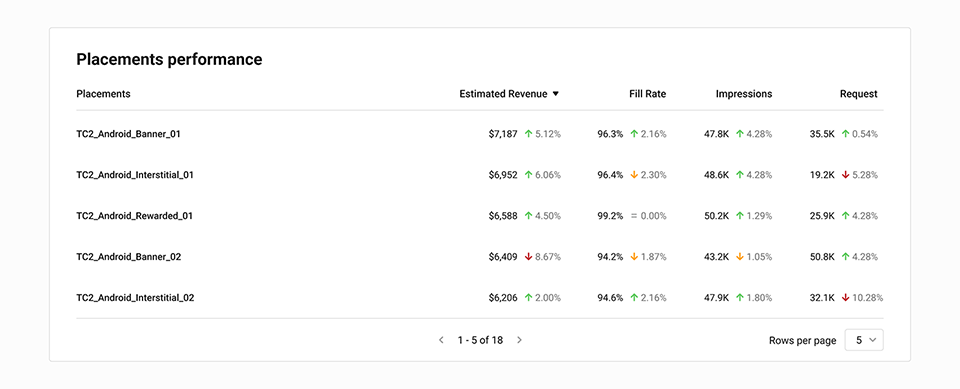
At the bottom is the Location Performance block, providing data on each location:
- Estimated revenue
- Fill rate
- Impressions
- Requests.
Observe the variation between the selected period and the previous one.
