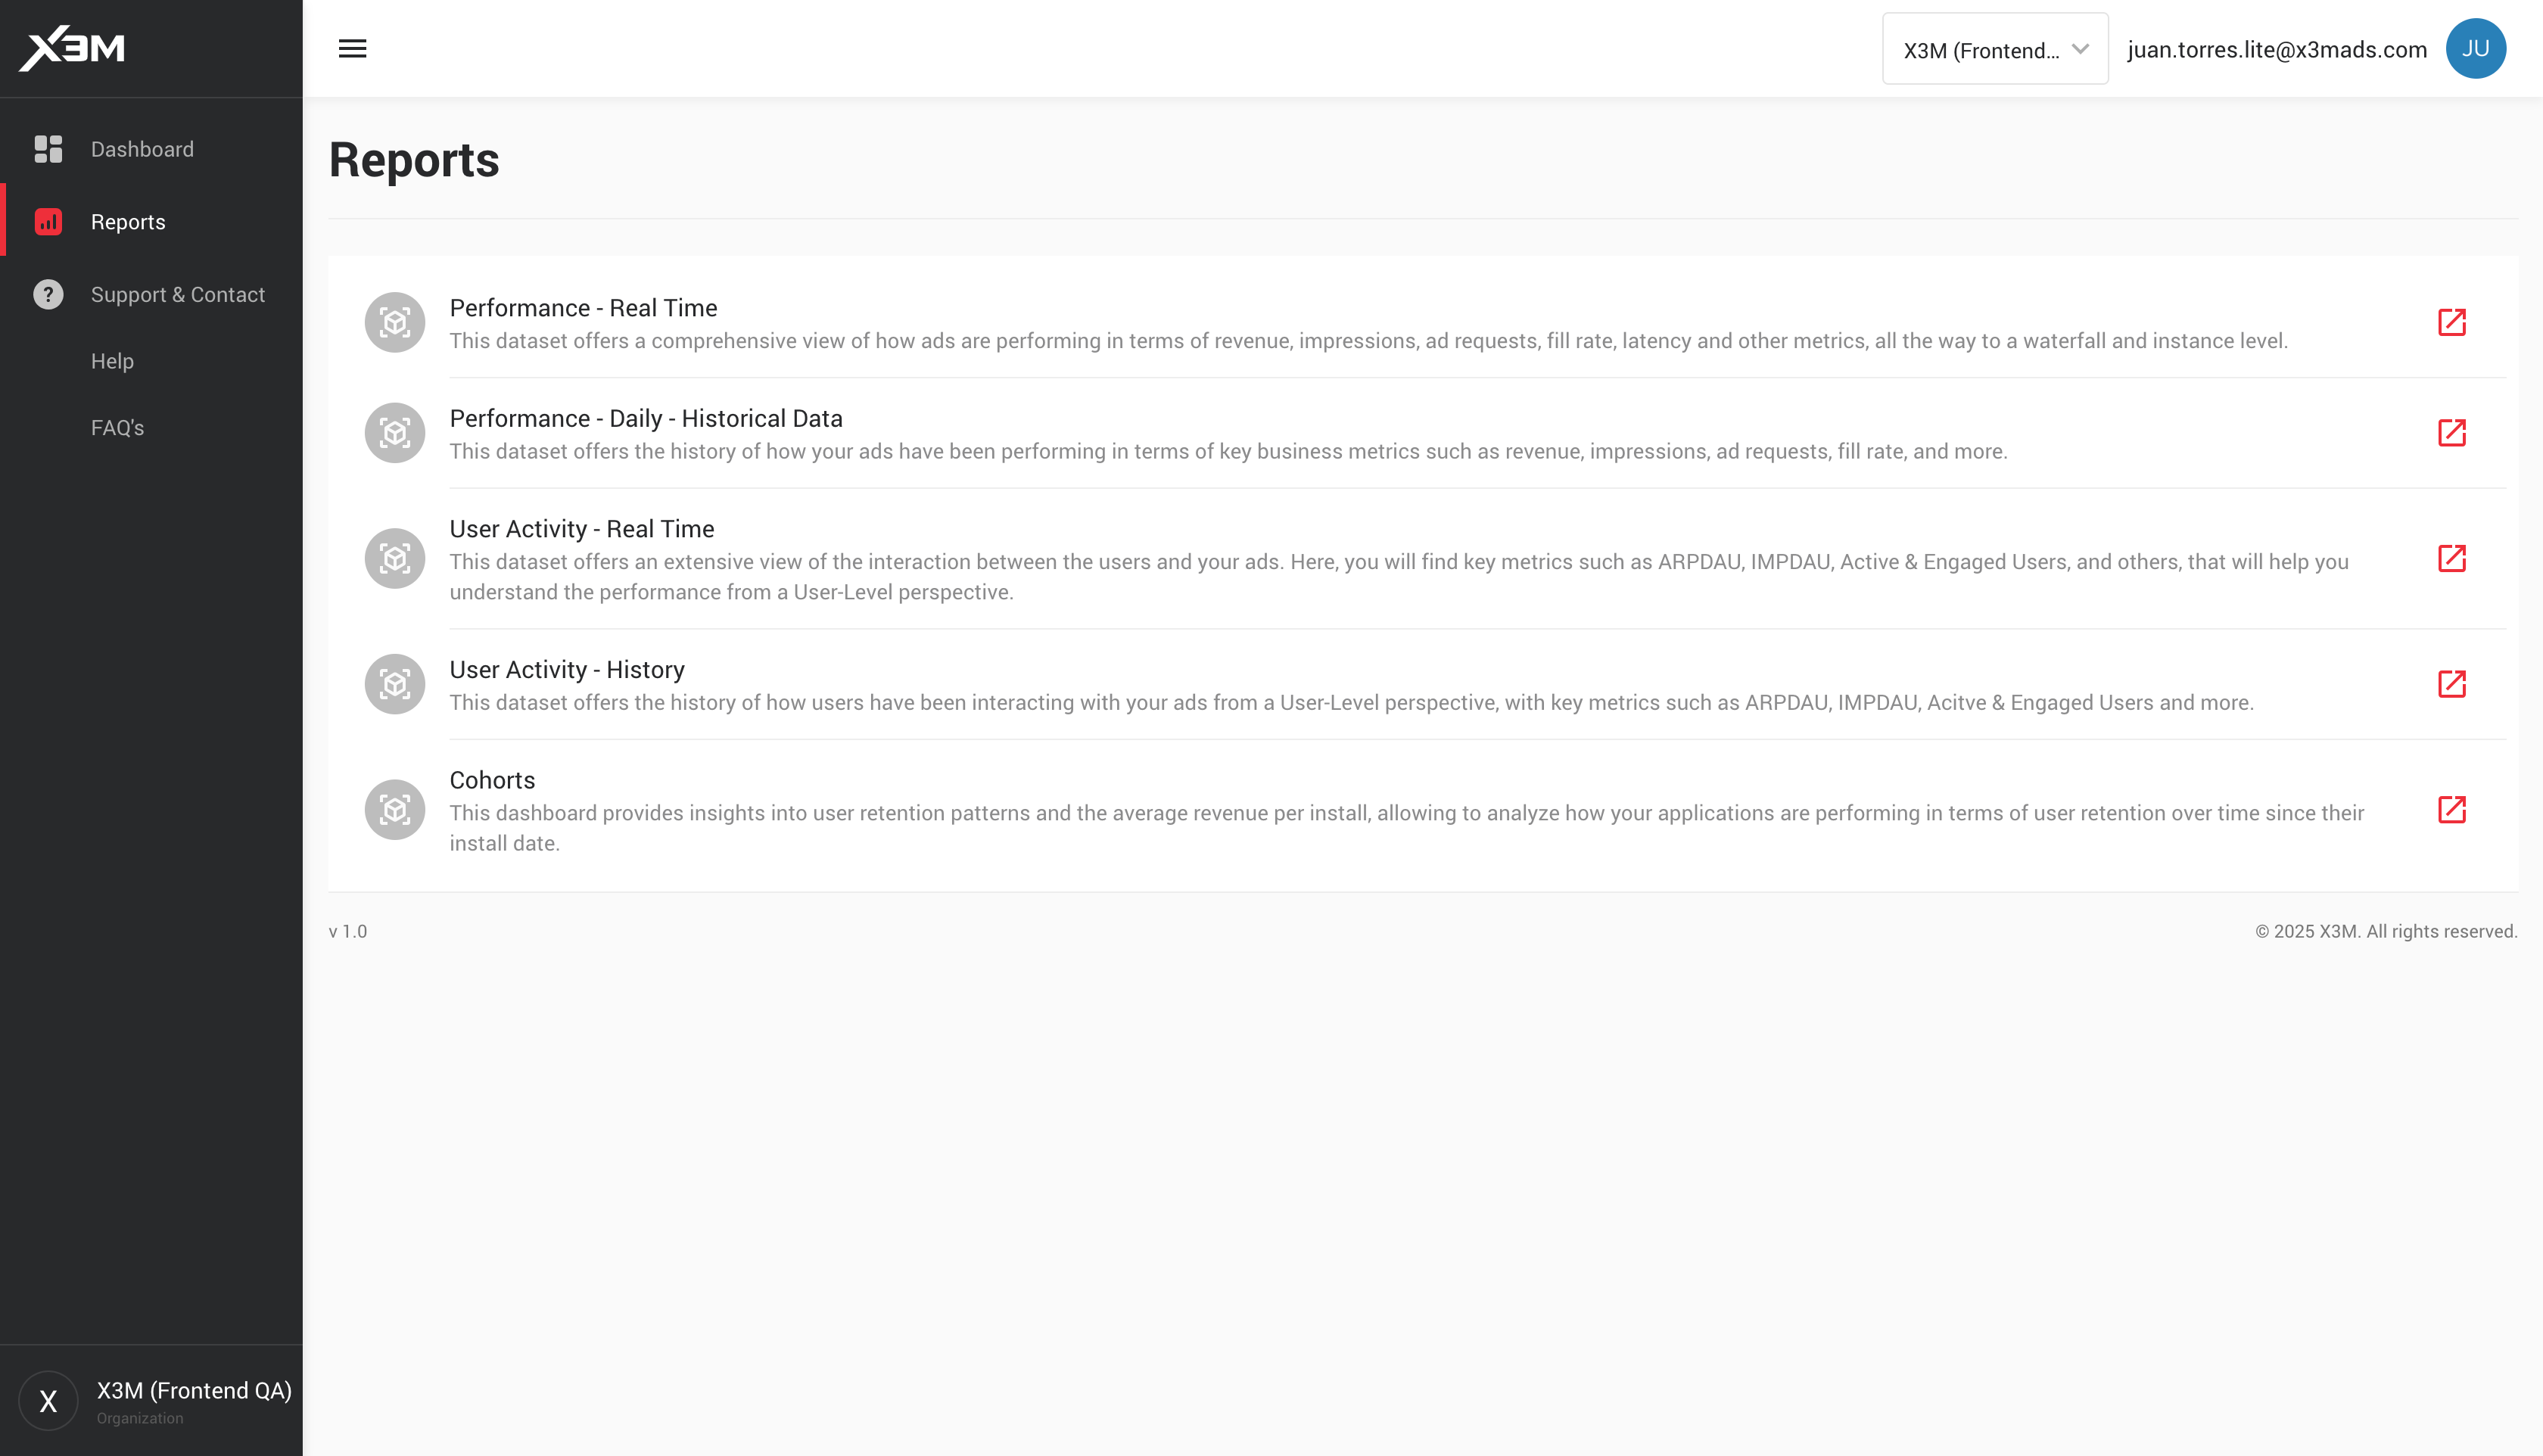
Reports
The Reports section serves as a comprehensive resource, providing diverse data sources for an in-depth understanding of your organization's performance. It equips you with valuable tools to assess and enhance your overall eddiciency.
Performance Reports
The performance reports allows you to evaluate business performance in terms of ads and at the level of mediator components in a customizable way regarding your interests.
-
Performance - Real Time: This dataset offers a comprehensive view of how ads are performing in terms of revenue, impressions, ad requests, fill rate, latency and other metrics, all the way to a waterfall and instance level.
-
Performance History: This dataset offers the history of how your ads have been performing in terms of key business metrics such as revenue, impressions, ad requests, fill rate, and more. This Data Cube is at a lower level of detail compared to the Real Time.
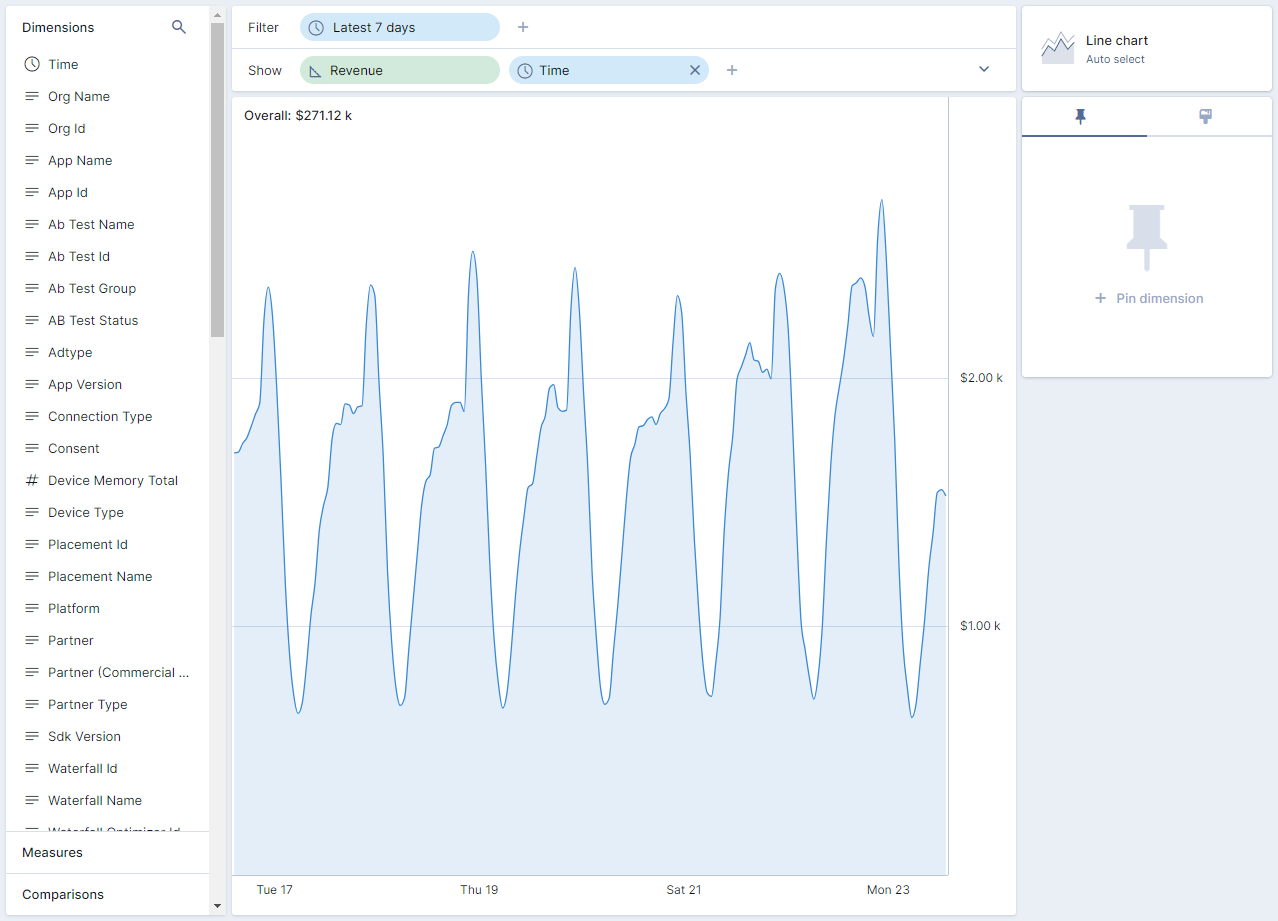
On the left panel, you'll find all dimensions that allow you to segment the data or only see results for certain Apps, Platforms, Partners, Countries and Ad Types. You can also segment or filter results by Placement, Waterfalls and Instances, among others.
Also, you can select the time frame you'd like to visualize.
Below dimensions, following on the left pane, you'll find all metrics that are available to monitor.
Next, on the top right corner, you'll find a variety of predetermined charts that will help us to better visualize our data, such as line charts, stacked area, bar chart and table, among others.
Know your metrics
- Avg. Close Rate: Average Time between an ad is shown and the user closes it.
- Avg. Instance Call Latency: Average time that takes an instance to give a response (whether the response is a match or an unmatch)
- Avg. Waterfall Position: Average waterfall position where a request matches an instance.
- Avg. Waterfall Request Latency: Average time that takes a waterfall to run (either having matched or not).
- Close: Number of times the ads are closed by the user
- Closed Rate: Percentage of times that the user close an ad
- CPM: Average cost per mille impressions.
- Failed Requests Rate: Percentage of requests that doesn't get to launch the waterfall.
- Fill Rate: Percentage of requests that turned out to be an impression.
- Fill Rate (Waterfall Level): Percentage of match requests and unmatch requests that turned out to be an impression.
- Impressions: Number of ads delivered.
- Instance Calls: Number of times an instance is called to match a request, where an instance is defined by its CPM and Partner.
- Instance Match Calls: Number of times an instance has matched a request when called.
- Instance Match Rate: Percentage of instance calls that have had a match.
- Instance Unmatch Calls: Number of times an instance has not matched a request when called.
- Match Rate: Percentage of requests that have matched with an instance.
- Match Rate (Waterfall Level): Percentage of match requests and unmatch requests that have matched with an instance.
- Median Waterfall Time to Show: Median of the time that takes a waterfall to show an ad (once it has run).
- Revenue: Ads income.
- Show Rate: Percentage of match requests that turned out to be an impression.
- Waterfall Match Requests: Number of waterfalls launched to fill an ad that have matched with an instance.
- Waterfall Requests: Number of waterfalls launched to fill an ad.
- Waterfall Unmatch Requests: Number of waterfalls launched to fill an ad that haven't matched with any instance.
User Activity Reports
The User Activity reports allows you to evaluate your performance from a User-Level perspective in a customizable way regarding your interests.
-
User Activity - Real Time: This dataset offers an extensive view of the interaction between the users and your ads. Here, you will find key metrics such as ARPDAU, IMPDAU, Active & Engaged Users, and others, that will help you understand the performance from a User-Level perspective and will allow you to monitor them on an hourly basis.
-
User Activity - History: This dataset offers the history of how users have been interacting with your ads from a User-Level perspective, with key metrics such as ARPDAU, IMPDAU, Acitve & Engaged Users and more.
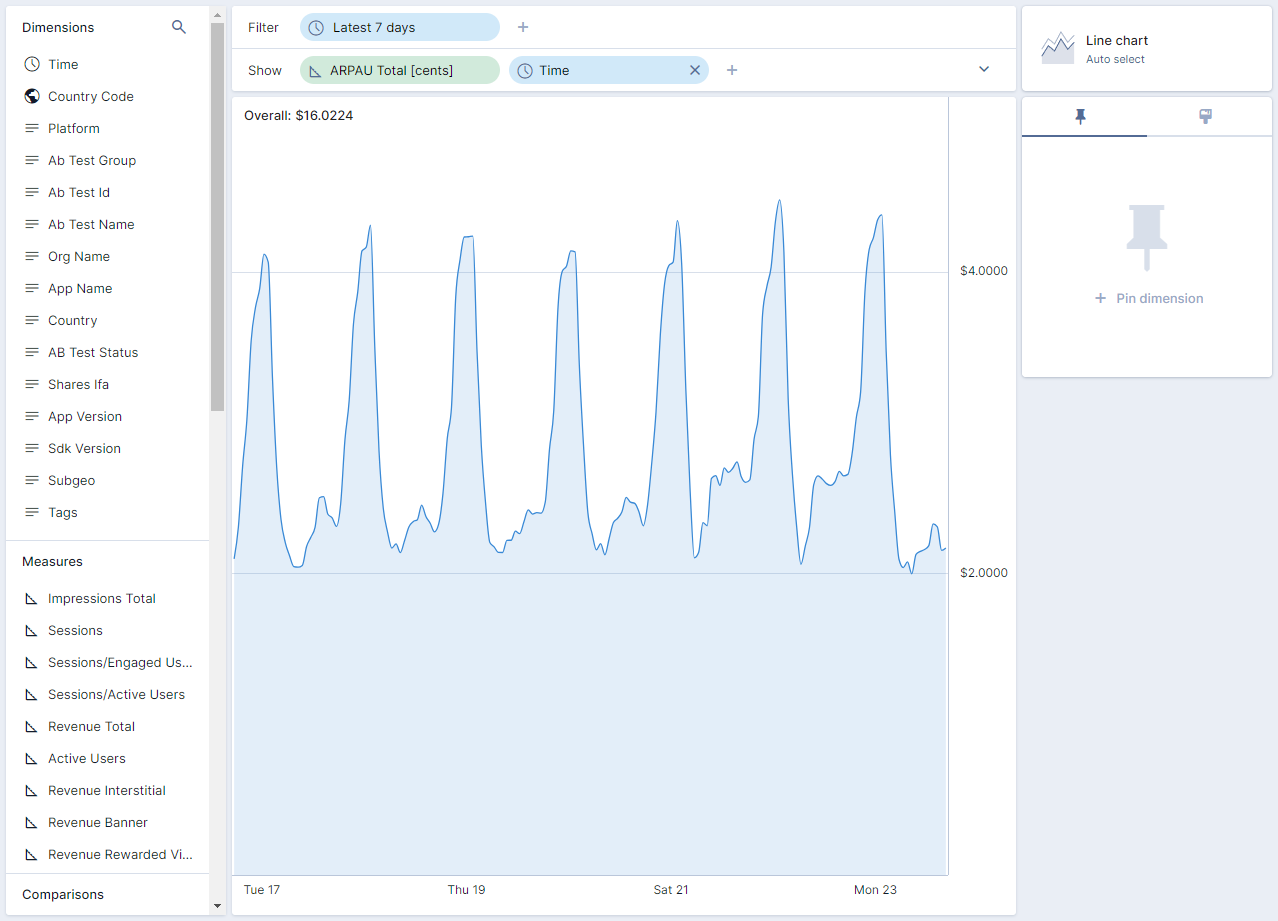
On the left pane, you'll find all dimensions that allow you to segment the data or only see results for certain Apps, Platforms, Countries, and some other dimensions that allow you to identify a user. Also, you can select the time frame you'd like to visualize.
Below dimensions, following on the left pane, you'll find all metrics that are available to monitor.
Next, on the top right corner, you'll find a variety of predetermined charts that will help us to better visualize our data, such as line charts, stacked area, bar chart and table, among others.
Know your metrics
- Active Users: Number of users that have initialized the sdk.
- ARPAU [cents]: Average Revenue Per Active User measured in cents.
- ARPEU [cents]: Average Revenue Per Engaged User measured in cents.
- Engaged Users: Number of users that have seen at least one ad.
- Engaged/Active Users: Proportion of Active Users that turned out to be Engaged Users.
- IMPAU: Average Impressions per Active User.
- IMPEU: Average Impressions per Engaged User.
- Waterfall Requests/AU: Average waterfall requests launched per Active User.
- Waterfall Requests/EU: Average waterfall requests launched per Engaged User.
Cohorts Report
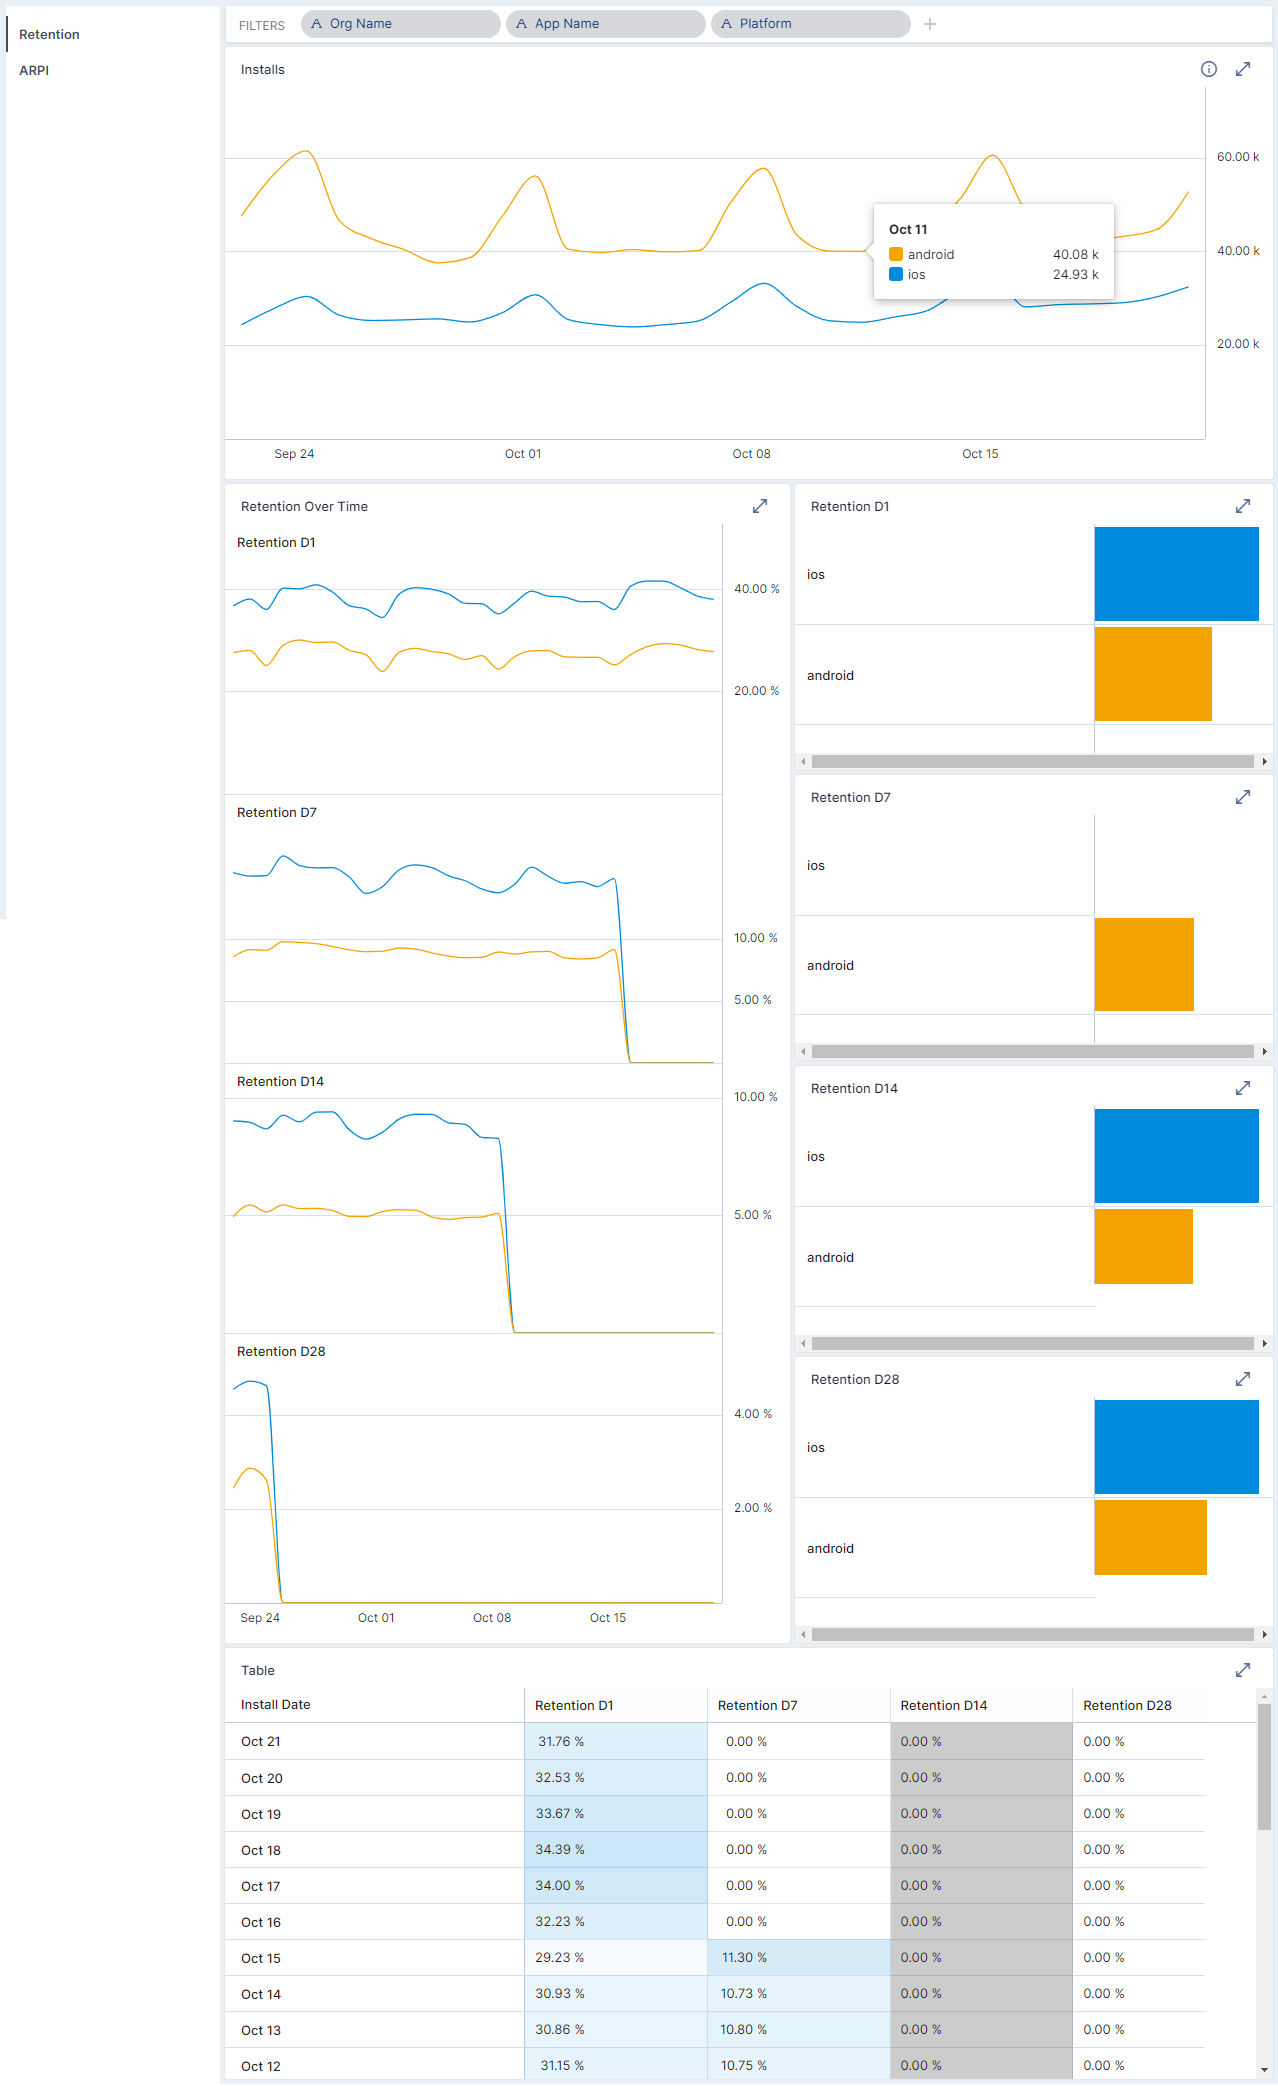
The Cohorts dashboard provides insights into user retention patterns and the average revenue per install, allowing to analyze how your applications are performing in terms of user retention over time since their install date. A cohort is a group of users who share common characteristics or experiences within a certain period of time.
This report allows you to measure your apps' retention to day 1, 7, 14 and 28 from install date. Also, in the second page of this report, you can analyze your apps' Average Revenue per Install (ARPI) to day 1, 7, 14 and 28. This will give you a better understanding of the engagement of your applications.
Upon entering the dashboard, you will find a group of filters on top to help you define cohorts that meet certain criteria.
You can first select an application and define a time period. By default, the last 30 days will be displayed. With these two values, you can view information on Installs, Retention, and ARPI metrics.
Know your metrics
- Installs: The daily number of installs per cohort.
- Retention: The retention of users for each cohort per day over a specified period of time.
- Average Revenue per Install: The average amount of income generated by each group of users by Install Date.
Ad Quality Report
Overview of your ads quality in terms of its close rate, time the users take to close and clicks over your ads.
This report allows you to analyze the general quality of the ads shown on your applications and also zoom in on the performance of the partners. This way, you are able to measure the quality of your ads depending on the partner who served it.
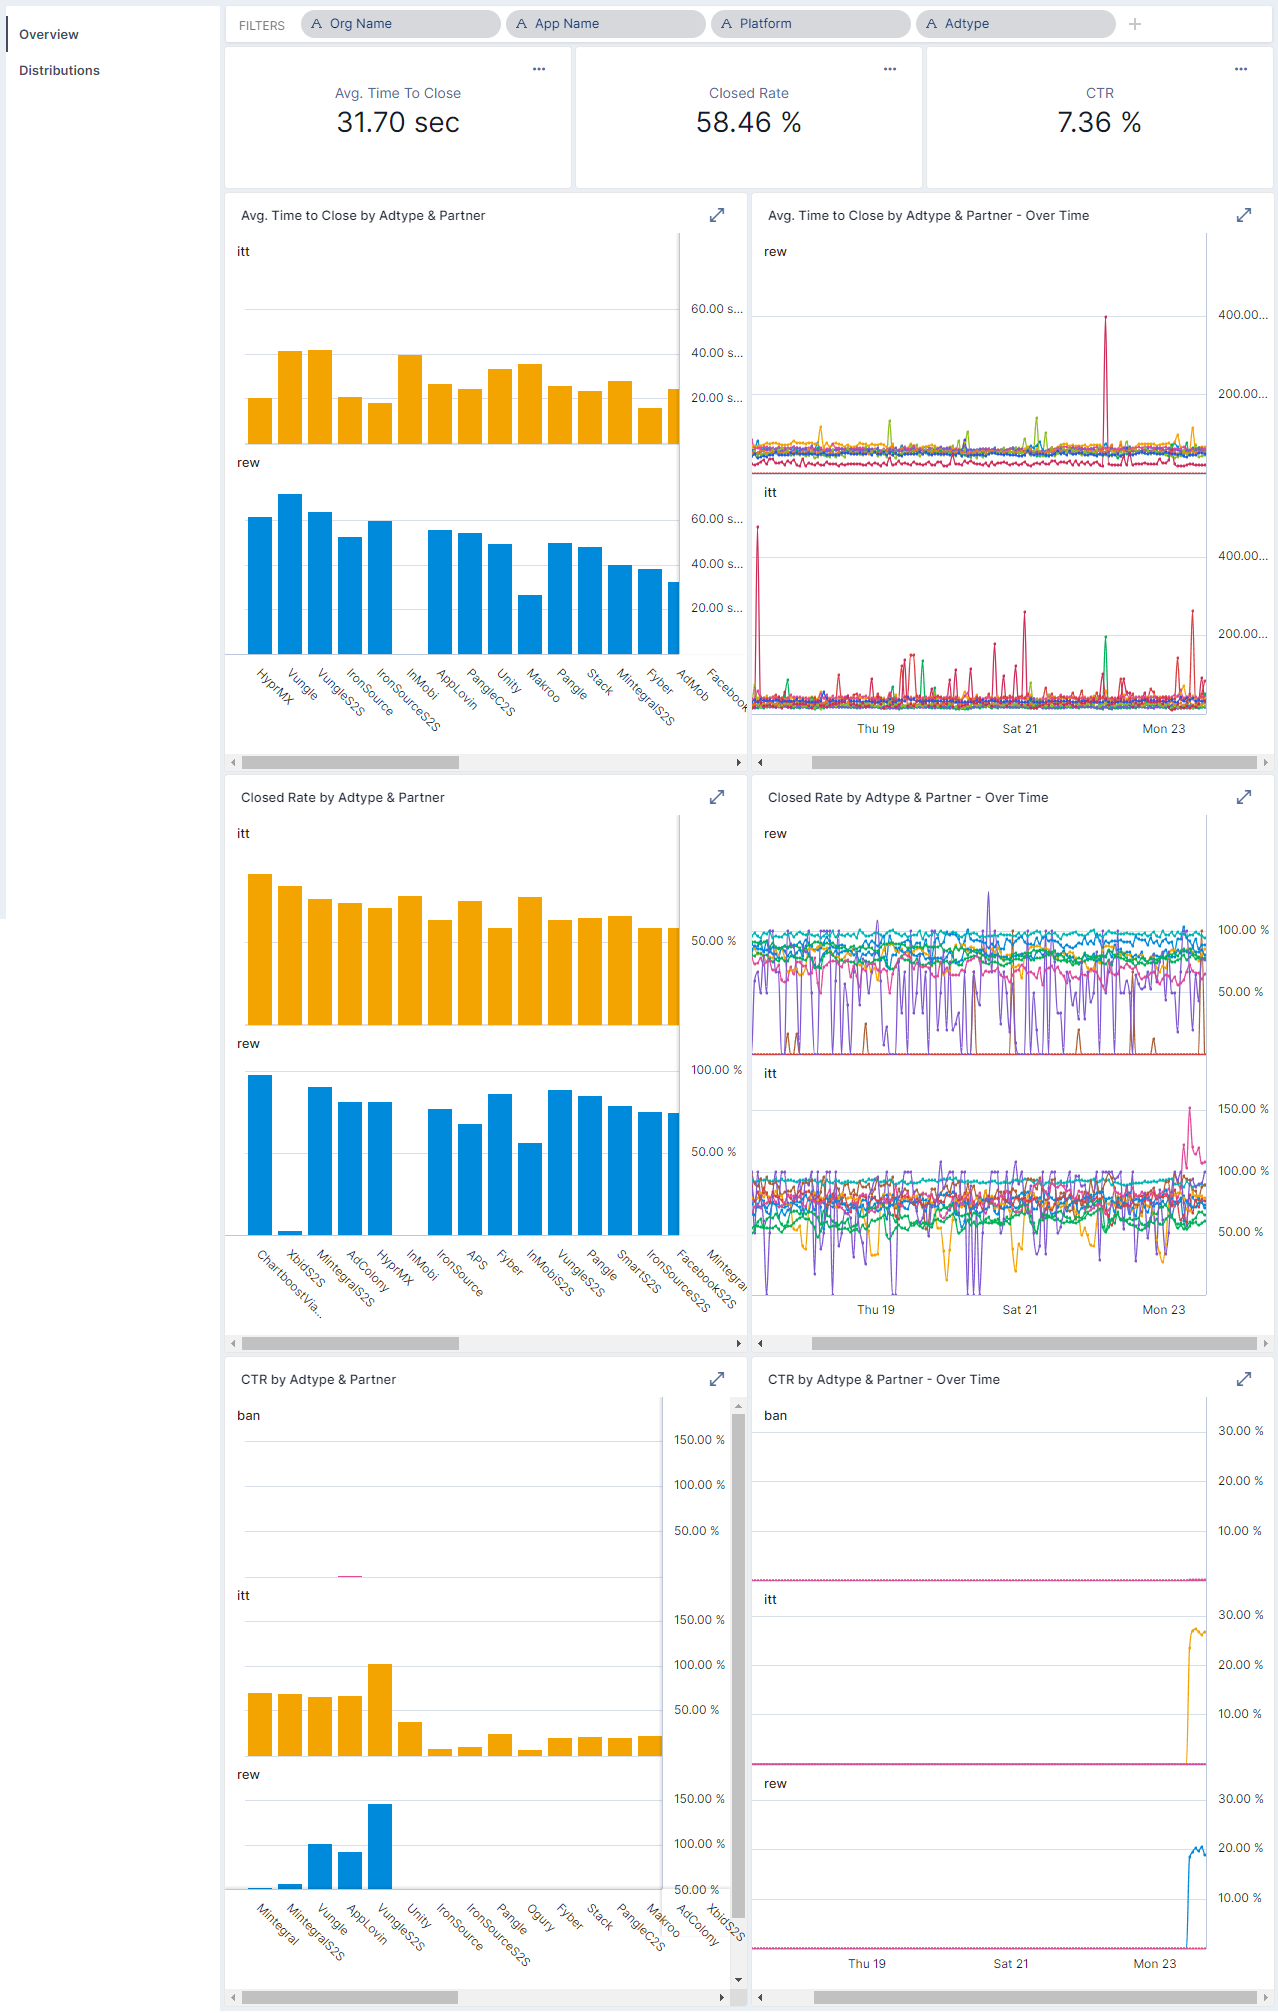
Know your metrics
- Avg Close Time: time between when the ad is displayed until it is closed by the user.
- Close: number of times an ad is closed
- Closed Rate: number of times an ad is closed normalized by number of impressions